Analyzing UFT election results – from 2022
JD2718 blog posts from May and June 2022.
Post-UFT election for the last two decades I have done some analysis of the numbers. I am getting ready to start pulling apart 2025. But first – I’ll repost all of what I wrote three years ago.
Three years ago a grab-bag coalition of many of the groups and caucuses opposed to the ruling Unity group came together under the name “United for Change” (UFC). UFC ended up taking 5700 votes among teachers (matching MORE/New Action from 2016) and over 8200 votes in-service. Unity had a particularly bad election and only got 7900 teachers and 13,200 in service (total).
The big take-aways from 2022 (but if you have the patience, you should read through)
- “Votes cast” tells the story far better than “percents”
- The elections shift as Unity voters decide to vote or not vote – or as non-Unity voters decide to vote or not vote. We are not (generally) competing for the same voters. That means everyone’s votes can go up (or down) in the same election.
- the “opposition” total votes cast from 2004 – 20022 were relatively stable (important for understanding what changed in 2025)
- Unity’s total votes cast among teachers and in-service steadily declined from 2004 – 2022.
- The Retiree vote does not follow the same patterns as the in-service vote.
- The Retiree vote AFTER Mulgrewcare shifted, and is still in flux (I’ll also discuss Retired Teachers Chapter elections, including 2024, 2021, and earlier.)
Now, I did write a lot three years ago. Thirteen blog posts? I don’t expect anyone to sit down and read this straight through. But it is a useful reference – perhaps for you – definitely for me, as I pull apart the 2025 numbers.
If you would prefer to read this as individual blog posts, I have added links to the original posts.
· What Would a Big Unity Win in the UFT Elections Look Like? (May 8, 2022)
· What Would a Big United for Change Win in the UFT Elections Look Like? (May 9, 2022)
· Even the incomplete results are incomplete (May 11, 2022)
· Unity scrapes out a win – United for Change takes high schools (May 11, 2022)
· More unofficial numbers (May 11, 2022)
· Good Luck (May 13, 2022)
· Analyzing UFT Election Results: My Data (May 14, 2022)
· UFT Election Turnout: Four Charts (May 15, 2022)
· UFT Election Turnout: Some Observations (May 15, 2022)
· UFT Elections: Voting Against Unity (May 21, 2022)
· UFT Elections: Voting For Unity? (May 22, 2022)
· Why do I look at total votes in UFT elections? (May 23, 2022)
· The Retiree Vote (June 20, 2022)
What Would a Big Unity Win in the UFT Elections Look Like?
We have a hot United Federation of Teachers election. Incumbent president Michael Mulgrew is the least popular UFT president, well, ever. The ruling Unity caucus, in power since the UFT was founded, looked weak and spineless during the pandemic. And our retirees, long a bulwark of Unity’s support, learned a year ago that Unity was forcing them off Medicare, into a private program. The retiree vote for Unity in an election as the news was breaking fell from 85% to 70%. These were danger signs.
The various opposition groups coalesced into one coalition: United for Change. (I am the High School Vice Presidential Candidate for UfC). They nominated a large number of delegates, and probably reached more members in more schools than any opposition campaign in memory.
The expectation, I am guessing, is that in this environment Unity’s vote total falls, a lot. They got 76% in 2016 (the larger oppo groups united) and lost 7 Exec Board seats (out of 102). In 2019 they won the seats back with 83% of the vote against a three-way divided opposition.
What Would Constitute a Big Unity Win?
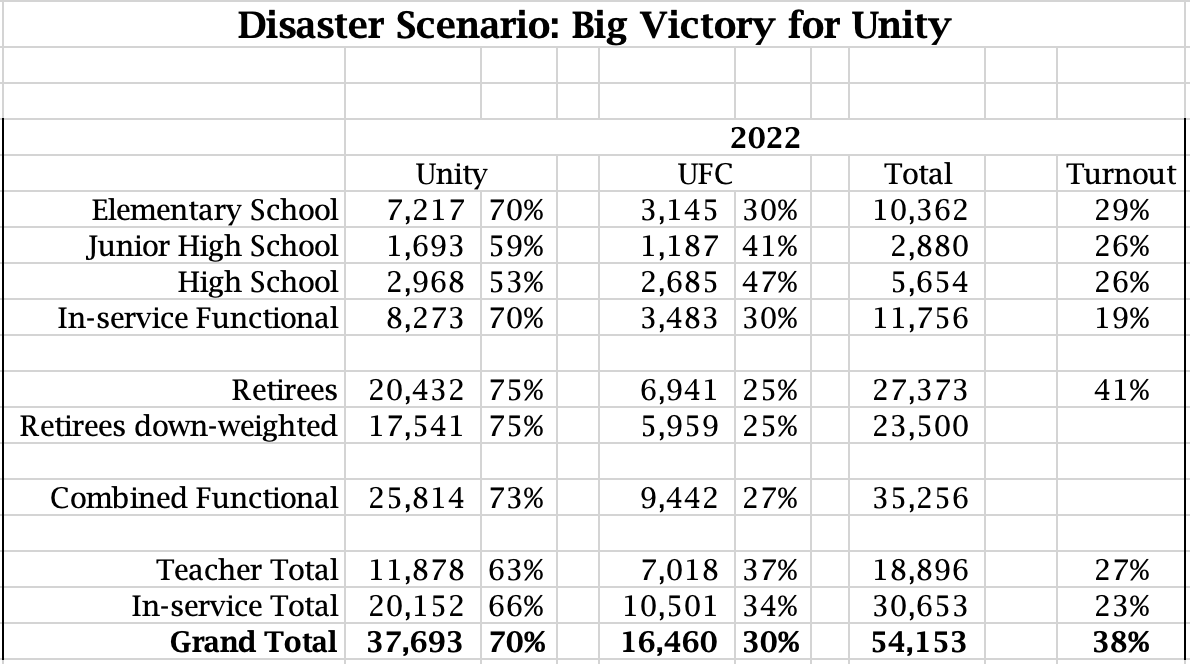
If somehow Unity kept its vote over 70%, and held onto 100% of the exec board, that would be a big win.
What would it look like?
Maybe it turns out that 70% was their low-water mark among retirees, while retirees had just heard the Medicare Advantage news. Unity might actually raise their total a bit from there. 75%?
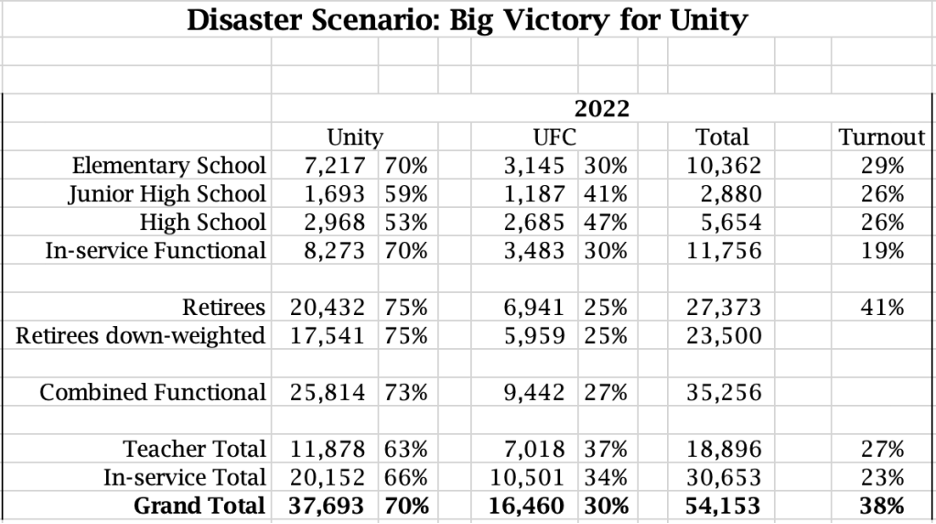
Sure, they might lose a few votes in each division (Elementary School, Middle School, High School, Functional), but not that many. Perhaps I have been overestimating the dissatisfaction over the pandemic? And some of the really bad policy was in 2020-21, which right now seems long ago? In 2019 they won 85%, 75%, and 64% Elementary School, Middle School, and High School respectively. They should lose votes, but maybe down to a manageable 70%, 60% and 51%, sweeping the seats (winner take all by division).
How Would They Have Pulled This Off?
They hid Mulgrew for the last four months. And maybe it worked. In December Mulgrew looked potentially the biggest vote-getter for the opposition – he was so unpopular. I begged Unity to drop him, for the good of us all, to no avail. Unity instead hid him, buried him. They canceled his events. They kept him off the campaign literature, and where they had to include him, did not make him noticeable. I went to the Unity Facebook page the other day. I could not find a single mention of him.
They shut up about Medicare. And people forgot. We have had almost two months of radio silence. Timing worked in Unity’s favor. A judge ruled in favor of retirees, and stopped the current implementation plan. But he showed the City and Mulgrew and the MLC how to work around the ruling (stop offering the old plan). But did Unity/Mulgrew jump at this? No. He is waiting for the campaign to end. They correctly judged that silence on Medicare during voting would save them votes. Just last week, after most of the ballots were cast, Mulgrew began sharpening his knife.
They put out good looking literature, with a unified theme. I wonder if they hired a pro? Seems like it. A media consultant to tell them what appeals to teachers. The irony of it. Some of the on-line stuff had serious issues with bad color choices that didn’t show, but the print stuff was fairly solid. And they did a full round of mailings, at least to ES, MS and HS teachers.
They highlighted individual members, especially in-service (and really in-service, full-time teachers, counselors, paras, etc). This gave them a better chance of having people campaign actively in schools, which they were never good at, but have gotten worse over the years.
They put pressure on supporters to cheat. We had pretty typical DR violations (mixing campaigning with union work, making it seem like voting for Unity was part of a union member’s responsibility, “branding” election work with union logos) but we had more lower level candidate violations (for example, lots of blocked access to mail boxes – which access is supposed to be guaranteed.)
And they successfully avoided a massive increase in turnout. Both sides knew that getting new voters to vote was key for the opposition. But Unity pulled every card they had – no electronic voting, no in-school voting, tricky ballot with double envelope, early deadlines for replacement ballots, conducting the election over break. They suppressed the vote. And in this scenario, they were successful, turnout barely rises.
For this to have happened, it would turn out that the United for Change outreach, while extensive, had been pretty completely ineffective. And it would mean all the new voters we think we encountered ended up not voting. And it would mean that the retirees who said they were switching to opposition changed their minds at the last minute.
What happens next?
In this scenario, Unity will draw the worst possible lesson. They will breathe a deep collective sigh of relief, and decide that all is good with the United Federation of Teachers.
Unity will decide there was nothing wrong with what they were doing. Mulgrew will remain president, for the indefinite future. Medicare Advantage will get restarted, and retirees will have to scramble to keep fighting it. Nothing will change?
Actually, something has been changing. The current course is corrosive. Unity/Mulgrew have been turning off members, badly, especially since March 2020. The support for the UFT from within the UFT has never been lower. Cynicism has never been higher.
Yes, Unity would have won. But with teacher turnout ticking up a few points, say as high as 27%, that still leaves almost ¾, a supermajority, disconnected.
Our union has been moving, slowly but steadily, in the wrong direction. The disconnect between membership and leadership has never been greater. This outcome will confirm Unity on the same path, a path to slow, steady decay of the UFT.
How Likely is this Disaster?
Definitely possible, but not very likely. United for Change has consistently received positive campaign feedback – probably not nearly enough to win it all, but more than enough to stop this doomsday scenario. Teachers are still angry about the UFT’s inconsistent advocacy during the pandemic. Even hidden, people remember it is Mulgrew running. Retirees do not seem less concerned with Medicare than they did a year ago – if anything, more of them are engaged on the issue.
Maybe a 10% chance that this happens? But I think that is high. Maybe a 5% chance – about 1 in 20. That seems right. Not out of the question, but not likely.
What Would a Big United for Change Win in the UFT Elections Look Like?
We have a hot United Federation of Teachers election.
The ruling Unity caucus, in power since the UFT was founded, currently controls 100% of the Executive Board. Every officer belongs to Unity. Also, every Borough Representative, every District Representative, every Special Representative belongs to Unity. And Unity uses some of these representatives to keep a lock on its control.
In 60 years Unity has always won the Elementary School division, always won the functional division. It is true that the lost the Middle School division once or twice, but that was decades ago. And they have lost the High School division many times, most recently 2016, though they won it back in 2019 and currently hold it.
Unity has always won the overall election – half the seats are at-large, all the officers are at large – and has always won it by a comfortable margin. In 2016 they got 76%, which I believe was their lowest total ever. In 2019 they climbed back to 83%.
On the other hand, incumbent president Michael Mulgrew is the least popular UFT president, well, ever. Unity looked weak and spineless during the pandemic. And our retirees, long a bulwark of Unity’s support, learned a year ago that Unity was forcing them off Medicare, into a private program. The retiree vote for the opposition (Retiree Advocate) in an election as the news was breaking rose from 15% to 30%. These were signs.
The various opposition groups coalesced into one coalition: United for Change. (I am the High School Vice Presidential Candidate for UfC). They nominated a large number of delegates, and probably reached more members in more schools than any opposition campaign in memory.
The expectation, I am guessing, is that in this environment Unity’s vote total falls, a lot. Losing 10% or 15%, would be a big deal. That would probably mean United for Change wins the High School division, and maybe even the Middle School division. That would mean controlling 11/102 seats on the Executive Board.
But is a bigger win for United for Change possible?
What Would Constitute a Really Big United for Change Win?
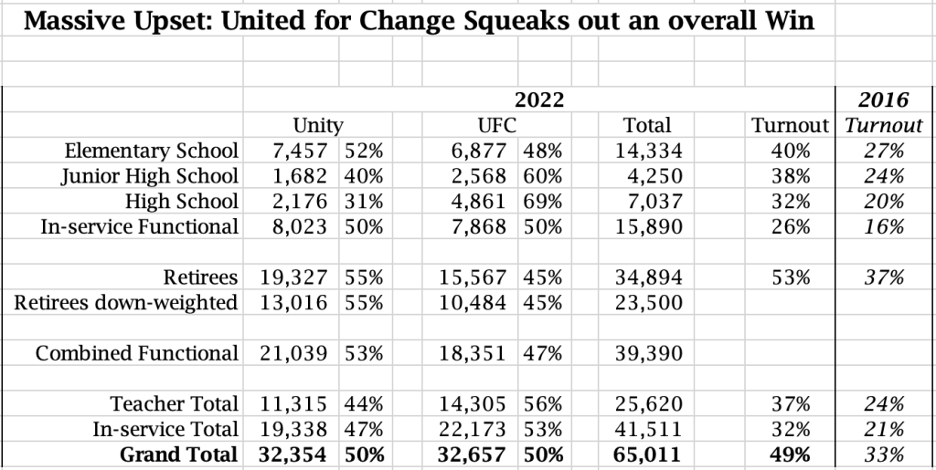
If somehow United for Change moved 20% of the vote, won the High Schools and Middle Schools, but put the other divisions into play, that would be a big win.
A really big win would tip things a few points further, and United for Change would win the overall vote, even by the narrowest of margins.
What would it look like?
Maybe 30% was just the beginning among the retirees, and they swing far further. Maybe a lot of non-voters are motivated to protect Medicare by voting, and those votes go overwhelmingly to UfC.
Maybe we cement our hold on the high schools, surge in the middle schools, and build some margin. And maybe we make enough ground up in the Elementary Schools to even things out. We could win two of the four divisions, and the at large seats. That would give us 70/102 Executive Board seats. We would win the 11 officer positions we are contesting. I would have a seat.
How Would United for Change Have Pulled This Off?
Mostly? Turnout. For this to happen, Unity’s threat to Medicare would have had to energize retired members who usually do not vote to do so. And they would have had to break heavily for UfC. Teachers in the schools would have to be even more tired of Mulgrew than we imagined, and non-voters became voters. And inchoate anger about the pandemic and the world would also have motivated teachers and others to vote for the first time. This scenario imagines teacher turnout soaring from 24% in 2016 and 18% in 2019 to somewhere between 35% and 40%. Notice, that is still low, too low. But it would require a pretty big increase in teacher vote.
So this scenario requires an almost unimaginable increase in turnout. But if turnout does surge, is there any doubt that the new voters would break heavily for United for Change and against Unity? That part makes sense.
Also, there would need to be former Unity voters switching sides. Something around 10%. Now, there certainly are defections, especially among retirees. And I have heard of some in service Unity people, including former chapter leaders switching. 10% seems like a lot. Another factor might be split ballots. At the count tomorrow we will see – are there Unity ballots that omit officers? one in particular? several? Each slate vote that becomes a split vote hurts Unity a little – though not as much as a defection.
There are other factors that we know about. United for Change made the case that voting for Unity was voting for Medicare Advantage. In this scenario, many members would have heard this, and either are already Medicare age, have relatives who are Medicare age, or are deeply committed to the New Deal and Great Society, and will vote to protect those programs
The pandemic hit the elementary schools differently than the high schools. United for Change has fewer campaigners in elementary schools, so we may have missed trends. Perhaps one of those trends was anger over having to go back into schools first (before high schools) and instructional lunch (much more a lower grades thing).
There are UFT members with strong opinions on pandemic policy – masks (in favor of them, against them), vaccines (mostly in favor, but some fervently opposed) – and just about all members with strong opinions are angry at Unity, or at least the person of Mulgrew. United for Change did not campaign for the “anti-vaxx” vote. No. But I bet they voted against Mulgrew – either by boycotting the election, or, in this scenario, by voting for UfC.
And then Mulgrew-fatigue may be even far greater than I imagine.
But United for Change did the work. We reached more schools with literature than any opposition ever has. Our messaging was sharp. Our print media was much better than Unity’s, and our social media was so good, they copied us.
I think we could have done more to increase turnout. But in this scenario, it turns out that our get out the vote efforts were particularly successful.
And of course our slate looked pretty good. And running women for the top officer slots was probably a smart move.
For all of this to have happened, it would turn out that the United for Change outreach, while extensive, was exceptionally effective. And it would mean all the new voters we think we encountered ended up voting. And many people we did not meet directly ended up voting for the first time. And it would mean that a significant number of Unity voters secretly voted for United for Change, or split their ballots. And it would mean that the retirees who said they were switching to opposition did so.
What happens next?
In this scenario, United for Change will win the Officers, and most of the Executive Board seats. Unity will retain one vice presidency, and 31 seats. I expect that Unity will challenge this result. There might be litigation. I hope not. I hope that wiser people than Mulgrew put the interests of the union over their desire to retain power.
In office, UfC will move quickly on a number of items.
- As rapidly as possible we will hold elections for District Reps.
- We will open the books on the Stabilization Fund, and review options. We will take Medicare Advantage off the table.
- We would probably open the proceedings of the contract negotiating committee to the membership as a whole.
- And we would prepare, super fast, for the AFT Convention (in Boston, starting July 14).
Between the results being announced, and us taking office July 1 we would need to meet and make many more decisions – but those are the first that I am confident we agree on. There might be some long term changes in staffing – but short term I expect (and do not know) that aside from a handful of key changes, we would want to make certain that the organization has a continuity of functioning.
I don’t know that UfC as a whole has given this much thought – but I would want to reach out to and consult with members of Unity Caucus who continue to serve the UFT. And I would especially want to reach out to the 30 or so Unity Executive Board members. Establishing a collaborative relationship would be essential – even if we do not always agree.
Members would notice right away. More information. More openness. Better responses.
How Likely is this Upset?
Definitely possible, but not very likely. United for Change has consistently received positive campaign feedback – but just not at the level of the teacher vote doubling or a full 10% of Unity switching sides. We will make gains, maybe big gains – but literally doubling the vote? Some signs are promising. Unity people are telling us that they switched. Even a couple of candidates told us they voted against themselves. We are surprised to encounter cluster of retirees who we thought were apolitical who have been actively spreading the word. And we have run into elementary school teachers who just want a change – in ways that we did not expect. But at this scale for this to happen? I don’t think so.
Maybe a 5% chance that this happens? But I think that is high. Maybe a 2-4% chance – about 1 in 25 to 1 in 50. That seems right. Not out of the question, but highly unlikely.
Even the incomplete results are incomplete
I wasn’t there to complain.
Missing Easy Numbers
This morning I was teaching. UFT Election chair Carl Cambria shared the number of votes per division (they are in the table, below), and Dave Hickey said that 198,900 ballots were mailed. Every other election he’s included how many were mailed in each division, which is helpful to understanding the other numbers we are seeing. But not this time.
When I arrived (almost 4) that breakdown was still not available. And I was not able to get it. “Tomorrow.” Nuisance.
Late Votes Counted
The deadline was receipt at AAA 8 AM Monday. A Monday is bad, and what is this 8AM nonsense? They decided (I assume the election committee?) to include ballots received Monday and Tuesday. Which is fantastic. About 1600 more votes.
(we should have probably checked to make sure these ballots were not from Arizona, right?)
Subtraction by Addition
But now we have less information, because all of the vote counts shared by division are now wrong. The total vote is up 1600, but we do not know what division those votes fall in.
A Surprising Nugget
Dave Hickey shared that he saw a pile of about 200 retiree ballots that were not slate (voted for individuals, not caucuses). That makes 99% slate voting. In the previous election retirees voted slate 95% of the time. We verified that this was approximately correct. That is a very big change. Was this election a referendum on Medicare? Turnout was up, although we wanted more, and there was quite a swing to UfC, though we wanted more, so yes, maybe yes. I’m a bit surprised. I expected more Unity voters to check off 11 officers, and omit Mulgrew. Maybe they either stuck, or switched completely.
Neither a Shocking Upset, nor a Resounding Vote of Confidence
I laid out two results in the last two days, both extreme. Neither the amazing United for Change upset nor that romp that would stop Unity from reexamining course happened.
A Table and A Chart, both bad
Since I don’t know where the extra 1600 votes belong, both the table and the chart are wrong. But close. I’ll do better graphics and numbers when they are available.
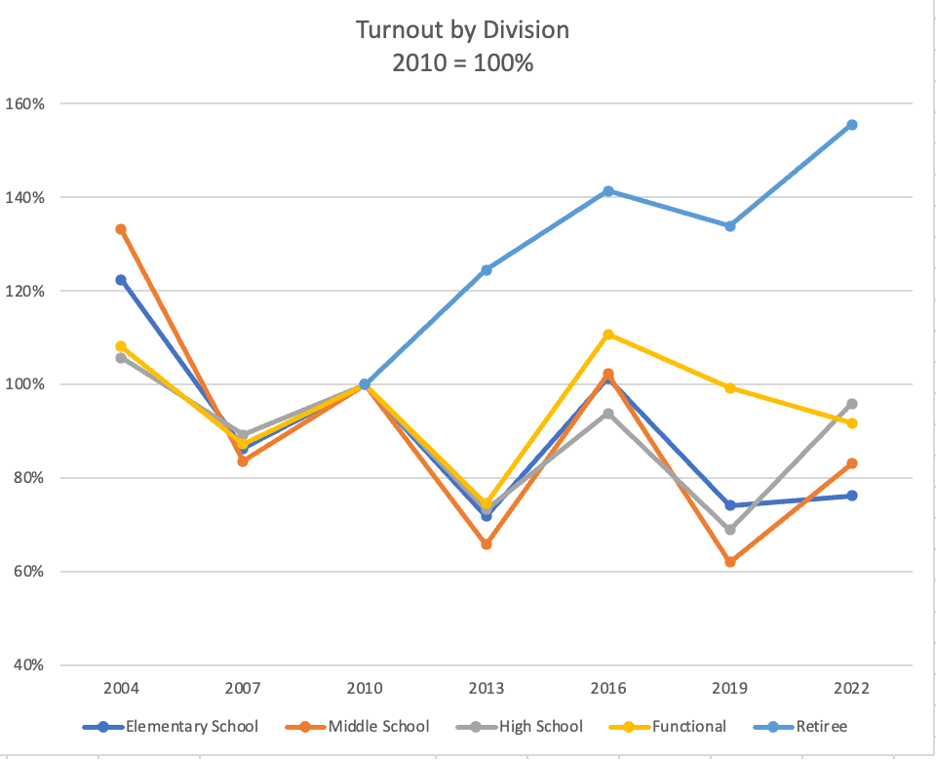
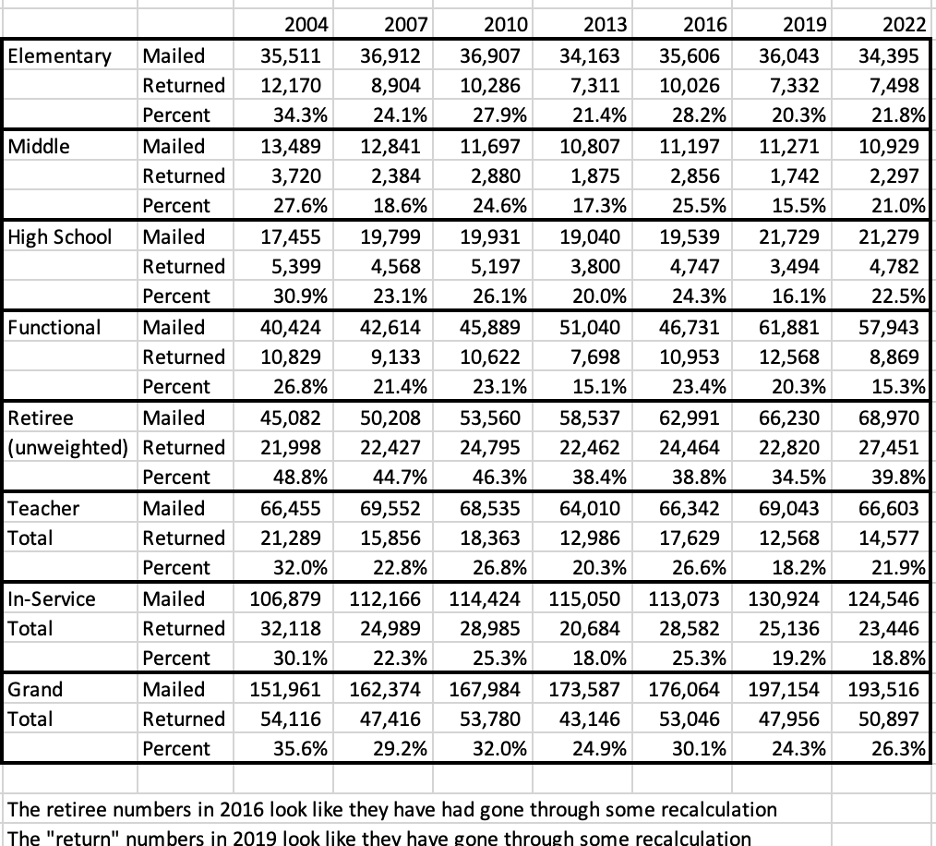
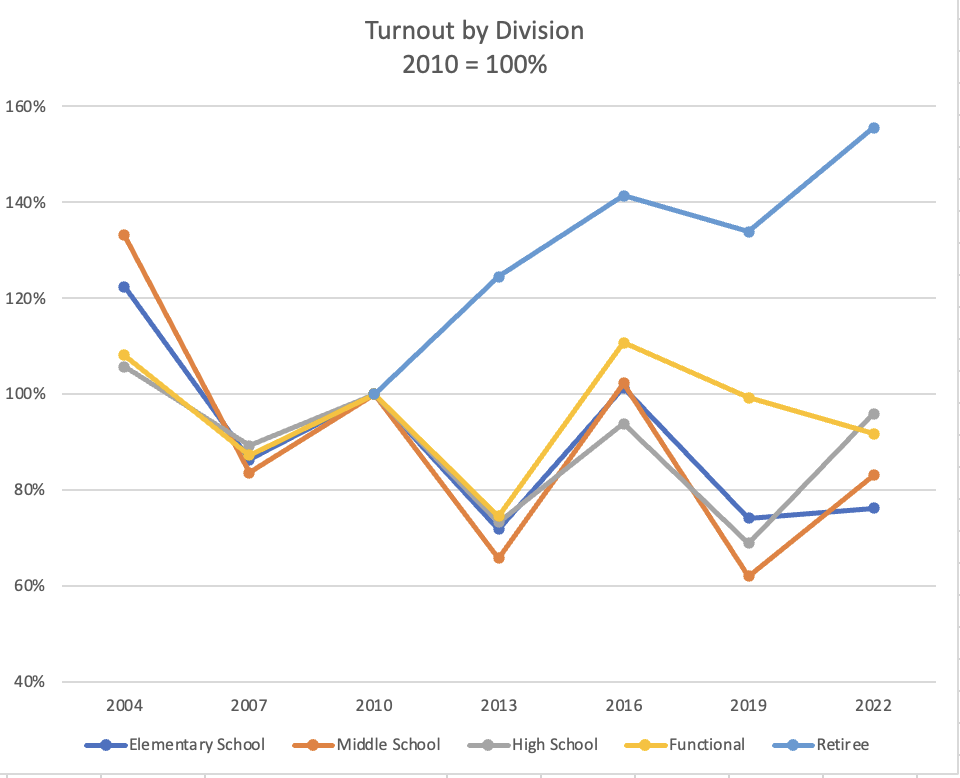
For now, the chart is just raw turnout by division, by year. I am missing two years of retiree data – what I had was just the cap number for those years.
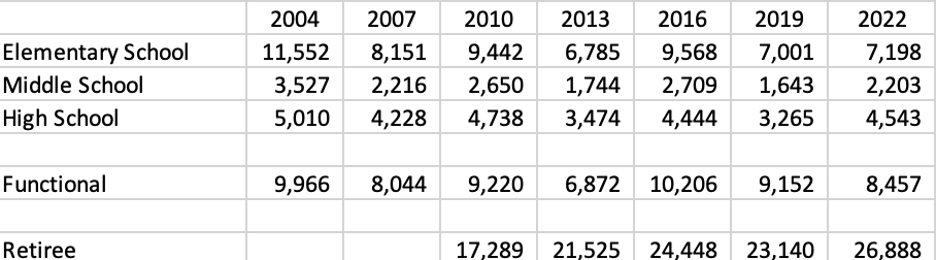
The 2022 numbers will increase. Older numbers come from a variety of sources.
The graph treats 2010 as 100% for each division, and you can see patterns. 2022 (still missing numbers) seems to roughly return to 2016 levels, after a dip in 2019. Wonder what happened to elementary? And the retirees are their own story (Medicare Advantage).
Unity scrapes out a win – United for Change takes high schools
Short quick post. Fuller results later. All of these numbers are unofficial.
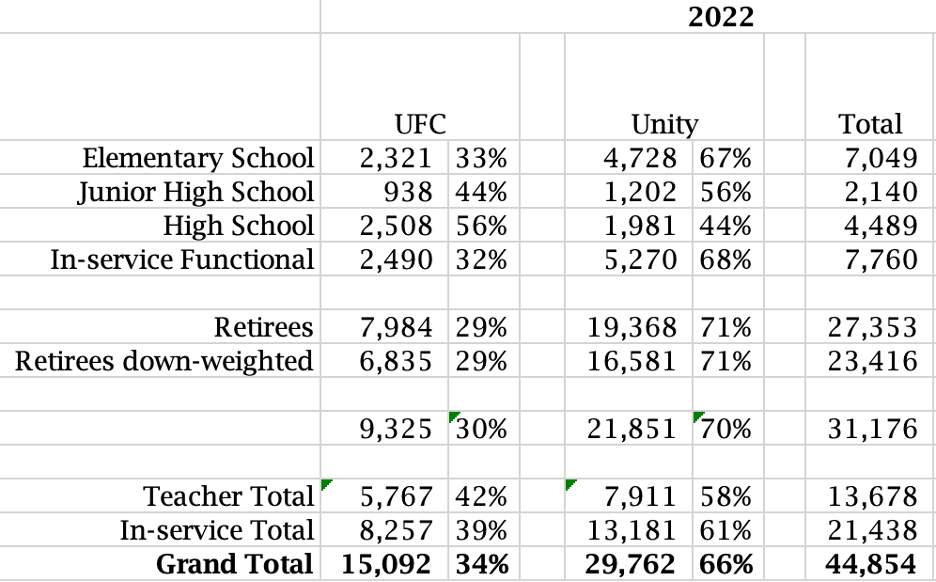
Unity took the overall vote with 66%, their lowest result in – honestly, I thought ever. Soldini told me the elections in the 1960s were tight. So their lowest total in at least 50 years.
Retirees – Unity 71%. They usually score 85-90.
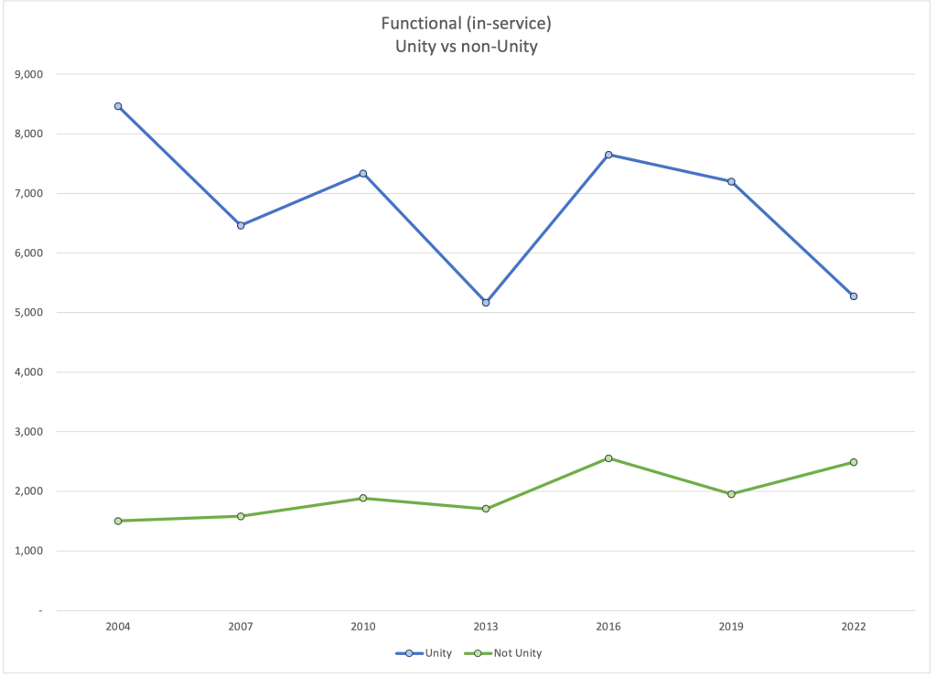
Functional – Unity 68%. They usually score 75-80%.
Elementary – Unity 67%. They usually score 75-80%
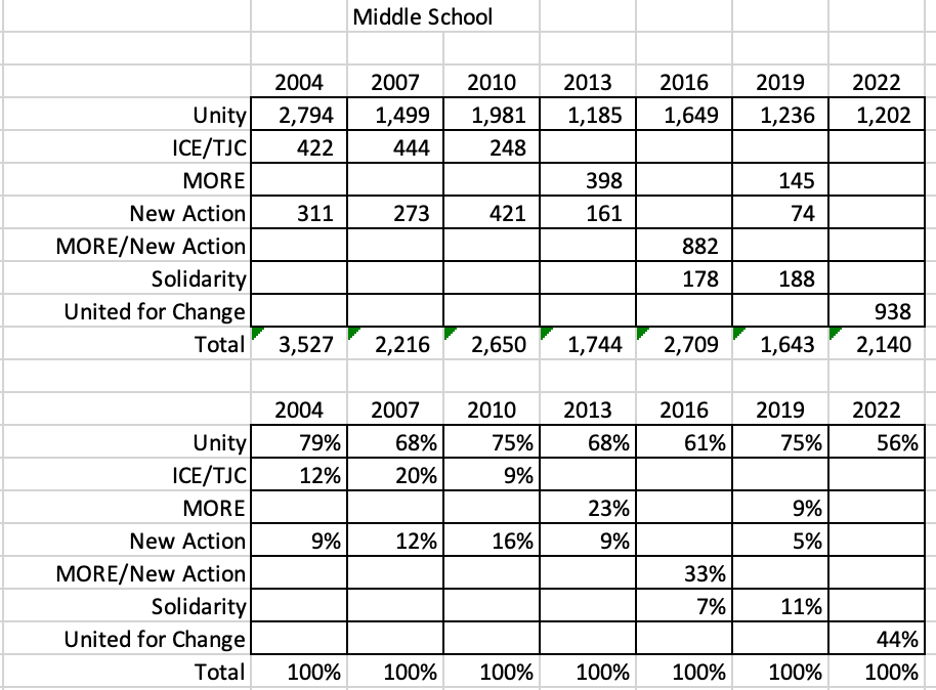
Middle Schools – Unity 56%. They usually score 60 – 80%
High Schools – United for Change 56%. This division leans opposition, but has swung back and forth.
Teacher total – Unity 58%. United for Change 42%. This is low. Unity has been between 65 – and 80%
More unofficial numbers
Maybe not “more” – maybe “better organized”
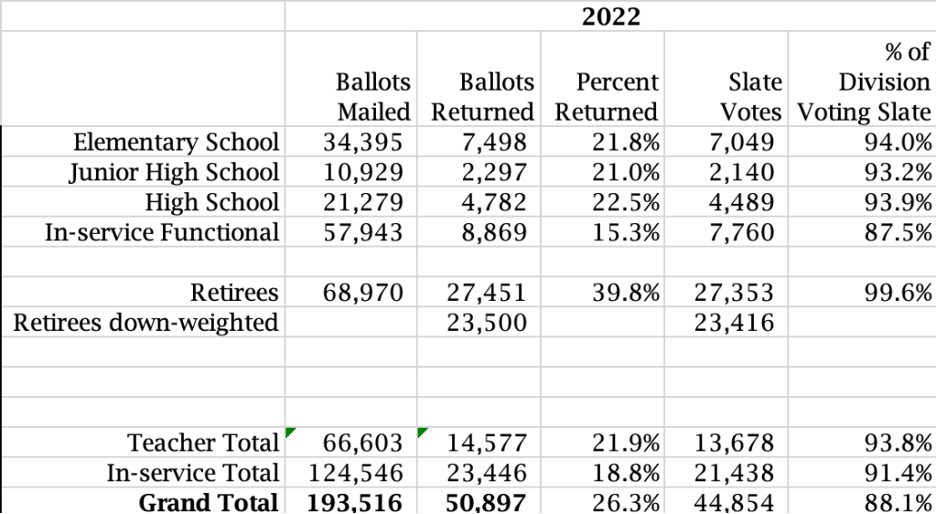

Yasmin Colon read us the numbers. Aloud. When she finished the ballots returned list, my hand shot up. The numbered return column didn’t add. She knew. Three ballots had problems, is that what I had noticed? People were kind of looking, weirded, at least a little, that I noticed 7,498 + 2,297 + 4,782 + 8,869 + 27,451 ≠ 50,900. I didn’t have the heart to explain, or the energy, frankly, that no, I had not added the numbers, just their last digits…
Good Luck
Good luck to those who won their UFT elections. Good luck especially to the United for Change high school winners.
But congratulations? I’m not so sure. With 79.5% of teachers not voting, I’m not sure that congratulations are in order for any of us. Unity won among teachers 11.88% to 8.65% for United for Change. Out of every 34 voters, 4 chose Unity, 3 chose United for Change. 27 did not vote. (numbers do not include D75 teachers – but those numbers should be similar).
In the coming days I will have more analysis of numbers. More analysis of how each side performed vs each other, but also vs our respective goals (or my estimate or guess of those goals).
But for now – some needed discussion
Engagement
- how will you increase member engagement? I do not mean voter turnout (and yes, we want to increase that). But low turnout is reflective of low engagement. And addressing that underlying problem, deep problem, is crucial. The strength of the union comes from its ability to unite the activity and energy and power of our members, and today that strength appears suspect. And that is a generous assessment.
Out of every 34 voters, 4 chose Unity, 3 chose United for Change. 27 did not vote.
Will this discussion happen within each side from the election? Will it happen within caucuses in United for Change? Or will all of us come together to address this?
Medicare
- the bit of engagement that seems to have increased, seems to have increased among one group of members – retirees. And pretty clearly that was driven by one issue – Medicare vs Medicare Advantage.
Will Unity continue to secretly deal with health care and the MLC? Or will we look together at the magnitude of the funding problem, and work together for solutions that are acceptable to our members? I don’t know. My gut says not to trust Unity – but the right thing to do is to set aside that mistrust, at least for the moment, and give them a chance to reassess.
I’ll get back to numbers and analysis.
But for today, good luck.
Analyzing UFT Election Results: My Data
Over the next ten days or so I will subject the recent UFT election results to some analysis. There is more here than
- Unity won 66% – 34%
- Unity’s vote totals were lower than usual
- United for Change raised its vote in most divisions
- United for Change won the high schools.
The real story will be more complicated. It might not be much more interesting. But as we ponder “what next?” it is important to have as complete a picture as possible of what just happened.
I will be using historical data. I have some historical data, going back to 2004. Some I took from Dave Kaufman. Some I compiled myself. 2019 has a different source; I’d like to double check it. And in 2016 some of the data appears altered – I myself may have been the culprit, as I wrongly adjusted for retirees’ percentage of a vote.
If you have corrections, please send them in.
If you would like the Excel file, please write to me.
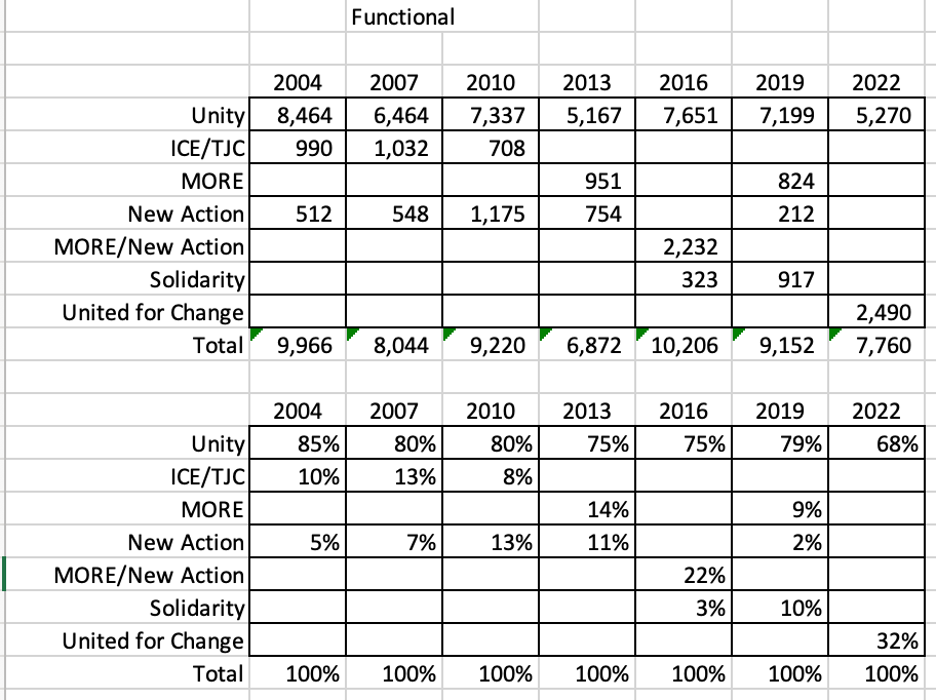
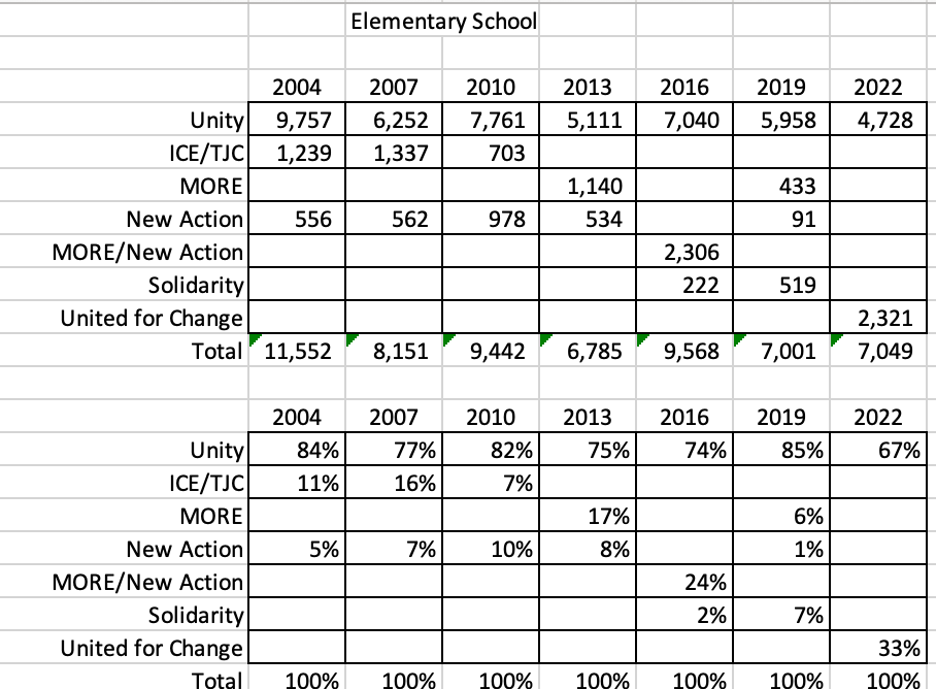
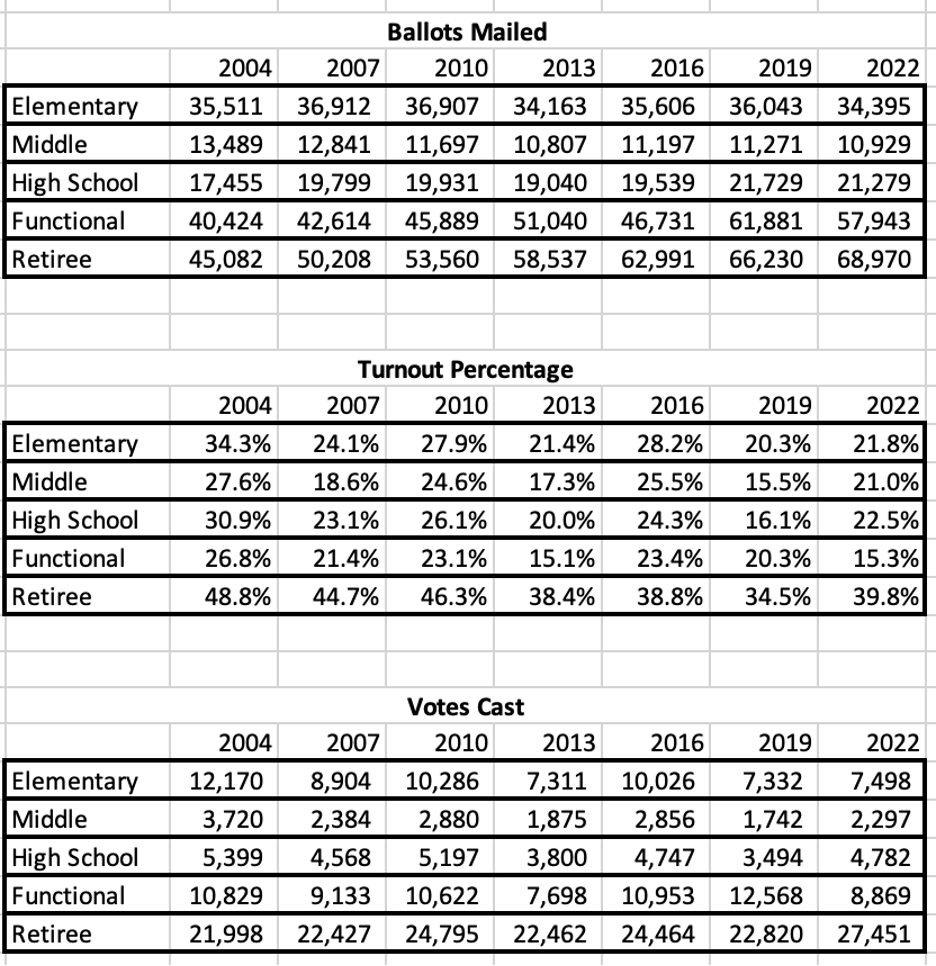
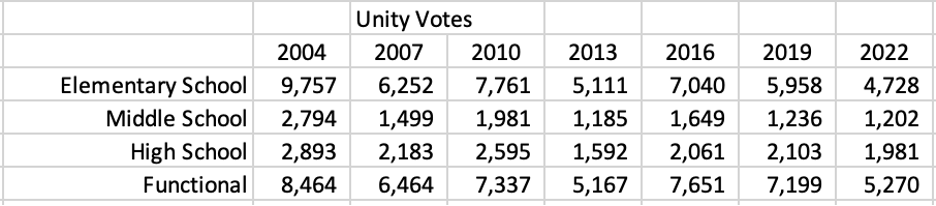
My results by division, both number of votes, and percents:

UFT Election Turnout: Four Charts
Let’s dive into the UFT election results. Let’s start with turnout. (For the beginning of the analysis, click here)
Votes Cast tells us more than Turnout Percentage
Turnout Percentage
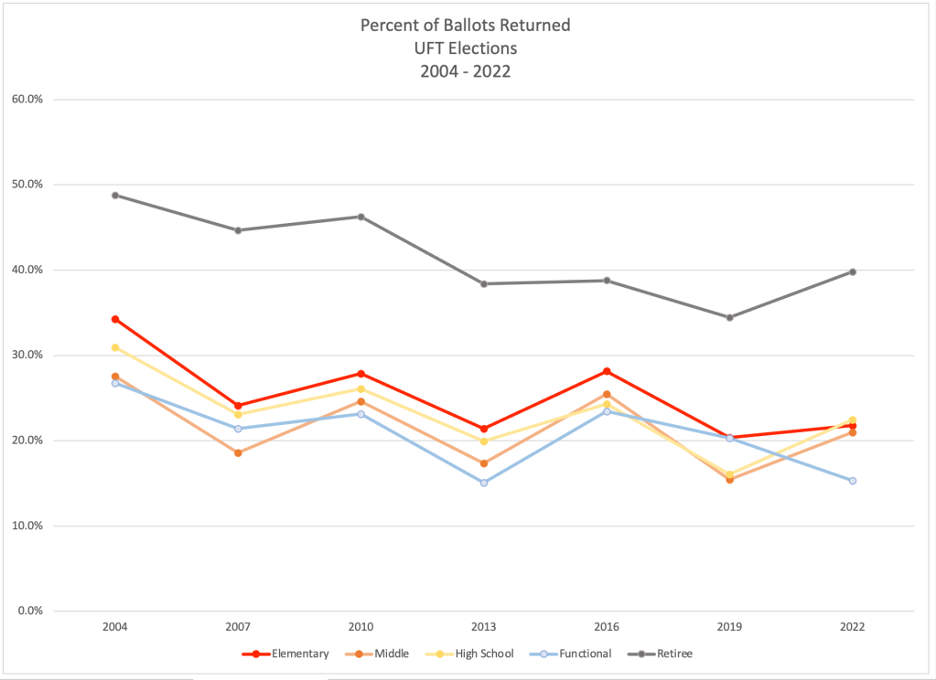
Turnout in all divisions is under 50%. And turnout has generally been falling in all divisions.
All divisions tend to move together. 2004, 2010, 2016 and 2022 were better years. 2007, 2013, and 2019 were lower. But the longterm slide is such that 2022, a better year, is not actually better than 2007, a bad year.
The rates move, more or less, together. Which makes 3 exceptions stand out:
- Retirees stand out for having a higher participation rate in general. And this year the rate among retirees. rose to better than the last three elections.
- In-service rates were moving together, mostly. But functional did not fall off much from 2016 to 2019, and then fell off noticeably from 2019 to 2022, while other rates were rising.
- Unexpectedly, elementary turnout did not rise this year in parallel with Middle School and High School.
Ballots Mailed

The number of retirees keeps going up! So the drops in percentage turnout are not as meaningful. And the RISE in percentage this year, even when the number of retirees was going up, means a lot of new voters. We will look at raw numbers of votes next.
The number of Middle School voters seems to shrink slightly. I’m guessing that’s due to teachers in K-8 and 6-12 being categorized as Elementary and High School, respectively. The middle schools are being squeezed.
The number of functionals has been rising, as we have adding categories or expanding categories of workers represented by the UFT. I don’t know why there is that blip in 2016.
This is the least interesting of the four charts.
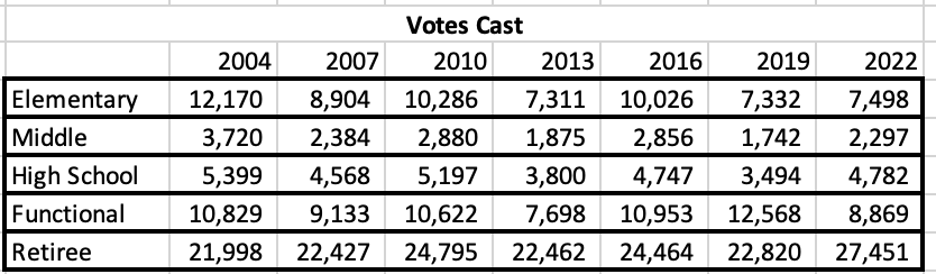
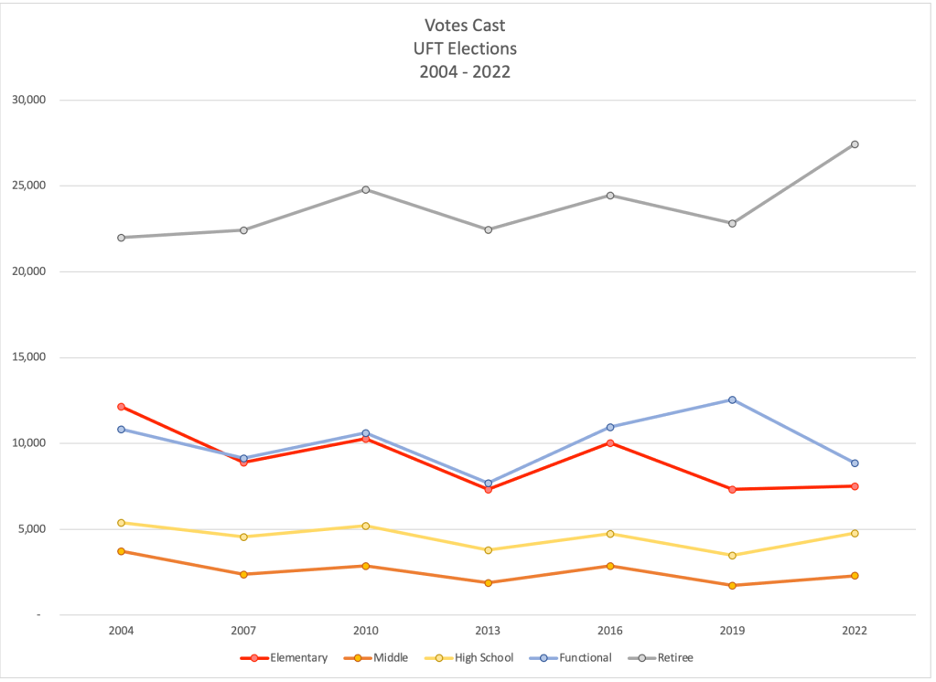
Votes Cast
Middle School and High School move, just slightly, and together. The overall trend is down, but slightly.
- Elementary moves in a more dramatic fashion, and has fallen further. The lack of rebound from 2019 is startling.
- Retirees are not part of the same trends. Yes, there is a little motion up and down, in synch with MS/HS. But unlike any other division, the overall trend is for more votes from retirees, not fewer.
- Also, the jump in retiree votes this time stands out – it is a “thing” independent of anything else in this chart.
Functional votes stopped tracking elementary votes when we added new titles.
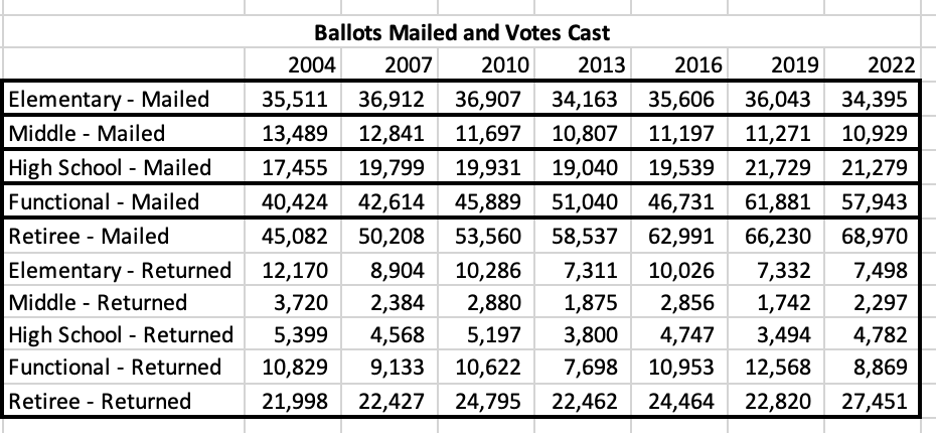
Putting Ballots Mailed and Votes Cast on one chart
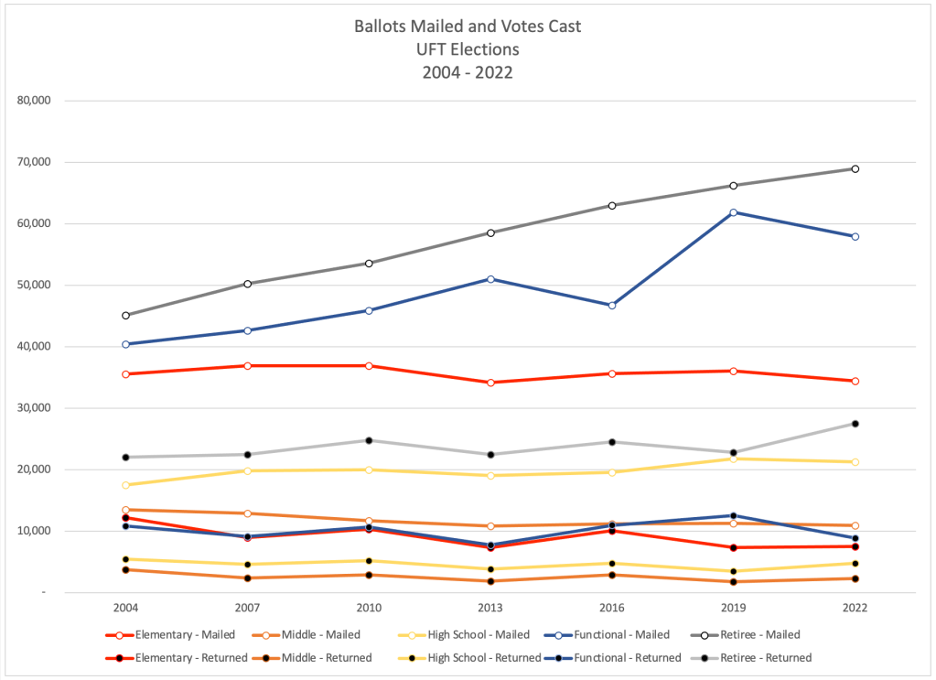
There is not obvious correlation. It looks like the votes move together year to year, independent of the number of ballots that were mailed. That suggests we should focus on votes cast, rather than on turnout percentage.
Data
Here’s what I used to create these charts:
As always, comments and corrections are welcome.
UFT Election Turnout: Some Observations
The number of voters seem to change without connection to the number of voters changing. What that means – I will be looking at the number of votes cast instead of the turnout percentage (with one exception).
Earlier I looked at all the turnout data, trying to locate patterns or breaks in patterns that bore further examination. Here are some things I found, followed by a first crack at some analysis. It’s not enough, not yet. I will be digging deeper in the coming days.
- The UFT elections have alternated between higher returns and lower. 2004, 2010, 2016, and 2022 were higher. 2007, 2013, and 2019 were lower.
- There is an overall downward trend in participation. It is significant enough that the number of votes in 2022, a year of increased voting, was less than 2007, a year of lower voting.
- Retirees do not follow this trend. The number of retirees is rising. The number of retiree voters is rising. The percentage of retirees voting had been slipping, but the most dramatic number in this election’s turnout was the surge in retiree votes, 4,600 more votes than three years ago.
- The number of functional votes plummeted.
- The number of teacher votes climbed from 2019 levels back to 2016 levels – EXCEPT ELEMENTARY.
It is going to take further digging to explain these points. But there is room for some initial analysis.
- The changes, year to year, in the number of votes cast likely reflect events in the Department of Education, or in the UFT. The last two “high” years, 2016 and 2019, there were very competitive elections (in one or two divisions).
- The overall downward trend is something we have seen before. It reflects, I believe, a serious disconnect between members and our union. Short-term teachers (and it is alarming how many come into teaching for just a few years. Shouldn’t this be a career choice) do not have reason, at least in their own minds, to worry about the union. In the day to day reality of many of us, we have colleagues and a principal, and we work out what we can. If the union’s power and influence are not felt, why invest time in that union? I disagree with that stance – it is wrong. But it is rational. I will come back to this. Turning the lack of engagement around should be a high priority. I worry.
- Part of the retiree puzzle is easy: Medicare Advantage drove turnout. The other part is trickier. I have tried in past elections to dig further into retiree turnout. It is complicated, and I’m not sure it is worth it. But, in case you are curious, here’s some stuff: New retirees often pay more attention at first. And the number of retirees went down (after the incentives 25 or so years ago cleared so many out), and then has come back up. Also, a significant number of retirees stay involved for the longterm, and treat voting as an obligation. (Voter participation in state and federal elections is also higher among older voters). Also, retirees are out of schools, and out of most of the controversial stuff. So as long as they keep voting, they will probably continue to vote the same way. Except this year…
- I do not understand the drop in functional votes. I will dig, and look, and ask. One guess – the numbers rose temporarily as family child care providers (how large is the number? Large, I think) joined the UFT and were glad to have a union, but with time interest has fallen. That’s just a guess. The only supporting evidence I have is the timing. I’m curious if you have better ideas. And whatever we think of, I’ll try to ferret out something more concrete.
- The low number of votes from Elementary School teachers will become clearer as I go into the data in more detail. For now, this was a “good” year in the other divisions, but in Elementary School it looks like a bad year (7500 this year, compared to 7300, 7300, and 8900 in the last three bad turnout elections). We have a longterm downward trend, but that didn’t stop Middle Schools and High Schools from rising. Perhaps this is a reaction to the pandemic. Unity’s policies, Mulgrew’s bad deals, they made high school people scream. But we were already voting against Unity. Some of the decisions hit the Elementary Schools especially hard. They had to go back into the buildings before the other divisions, and before vaccines were available. “Instructional Lunch” which, if you read the language, was clearly a policy the UFT proposed to the DoE, hit Elementary Schools particularly hard. And even for teachers who did not get sick, being scared is a real thing, and not so easy to forget. I’ll get into this in further analysis, but it appears that a large number of loyal Unity Elementary School voters threw out their ballots this time.
Each of these points is a first stab at an explanation. They need further exploration. But the outlines are coming into focus.
Below is the data I relied on, with the total votes captured in a chart.
As always, comments and corrections are welcome.
UFT Elections: Voting Against Unity
United for Change won 34% of the total vote, and 42% among teachers. Fairly impressive. But how many VOTES did United for Change win? In an environment of declining turnout, do those percentages represent real gains? Or something else?
See also:
Let’s look first at the percentages, and then at the vote totals. Finally we will consider non-voters. I will use historical data from the last seven elections, going back to 2004. And for today I will only be looking at the four in-service divisions. The retiree vote requires a separate post.
In-service percents
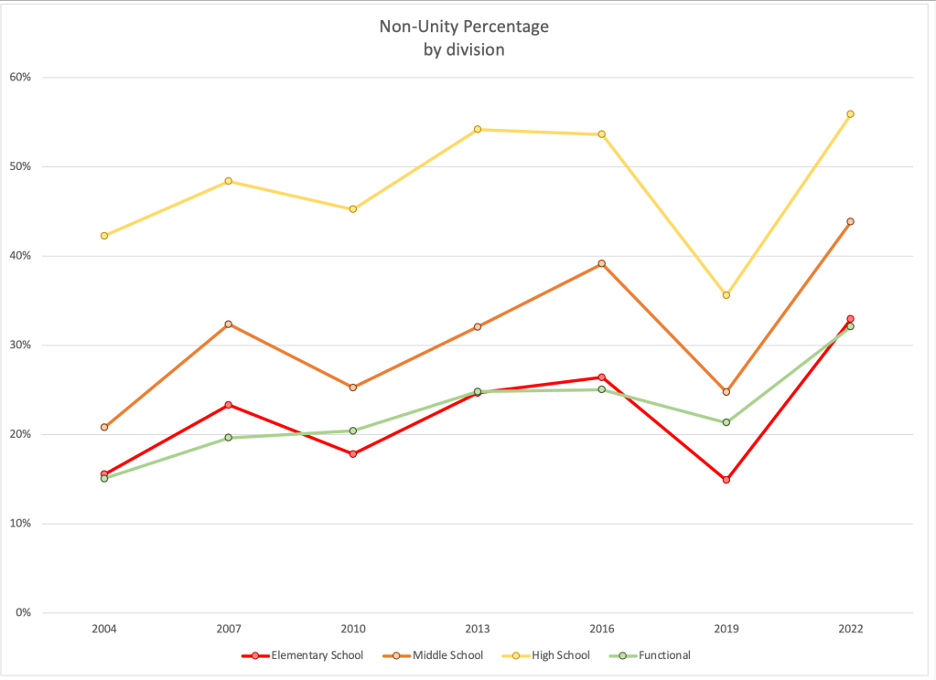
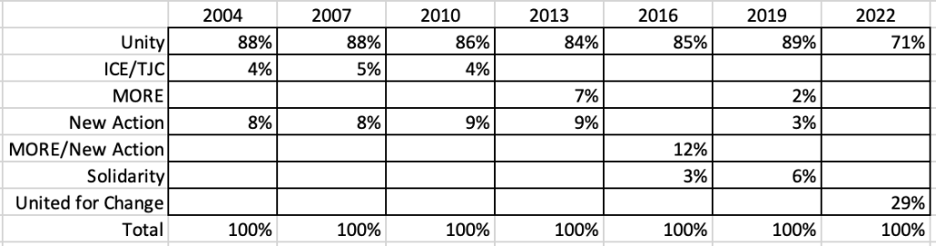
Calling anything an “opposition total” would be at least a little controversial. New Action’s votes from 2004-2013 went to Unity’s presidential candidate. Yet those voters chose to vote for hundreds of New Action candidates, and were declining to check “Unity” on the front of the ballot. I was quite hostile to Solidarity in 2016 and 2019. Yet it makes sense to combine all the non-Unity votes to get an idea of what was going on. So I’m just lumping them together as “Non-Unity.”
And a general pattern does emerge:
- relative stability 2004 – 2010
- a small jump in 2013 (most impressive in high schools, least impressive in middle schools)
- another, smaller jump in 2016 (actual dip in high schools, most impressive in middle schools, balancing out 2013)
- big drop in 2019
- return in 2022 to an increase on 2016.
Imagine that 2019 didn’t happen – do we have a straight line of increases from the averages of 2004-10, through 2013, 2016 (skipping 2019) to 2022? Take a look:
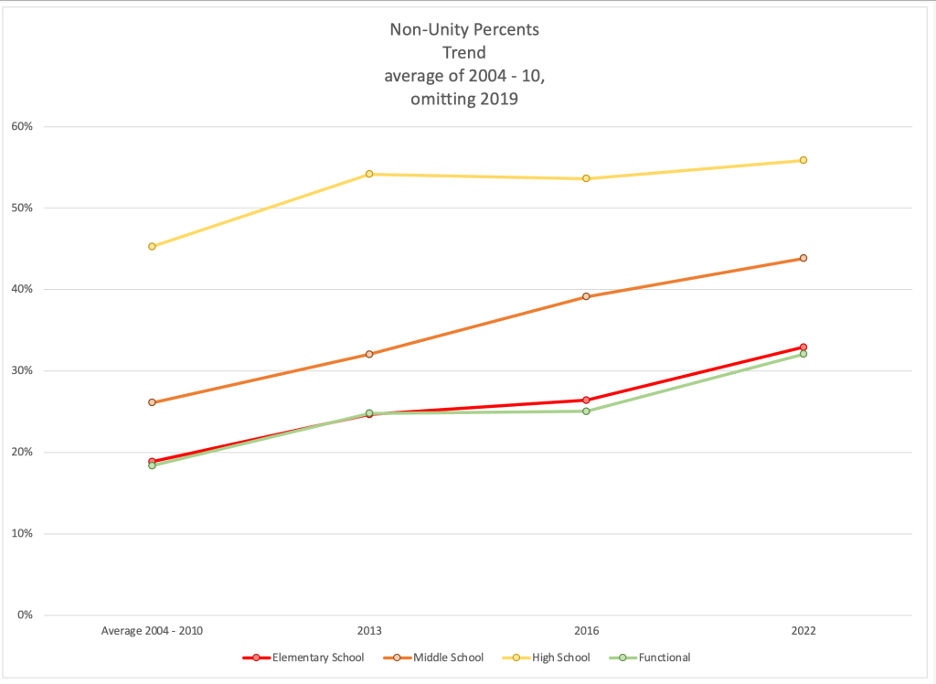
Is this a picture of steady progress? Is “the opposition” inexorably moving forward? Should we project the year “the opposition” overcomes Unity? (2025 in middle school? 2028 or 2031 among functionals and in elementary schools?) That looks very tempting. But this is the wrong graph.
In-service votes
Let’s look at in-service votes that went to opposition groups. I claim this is a better representation of how the opposition groups are doing. The percents measure us versus Unity, but that is not how voting in the low-turnout UFT works.
Do we struggle FOR the same votes? I would argue, mostly, no. Despite the bickering on Twitter and FaceBook, most of those who participate in those scrums have already made up their minds. We lose and gain relatively few votes by winning people over from the other side (as much as we are delighted when that happens. And it did happen a bit this election, but among retirees).
We might struggle to “get out the vote.” Unity does, too. But we are working in essentially separate universes. Most of our gains or losses involve people choosing to vote, or choosing not to vote.

There are still ups and downs when we look at the votes, rather than the percents. But the pattern is not so clear.
Let me narrow the data again, looking for a deeper trend. Same as above, imagine that 2019 didn’t happen – do we have a straight line of increases from the averages of 2004-10, through 2013, 2016 (skipping 2019) to 2022? Take a look:
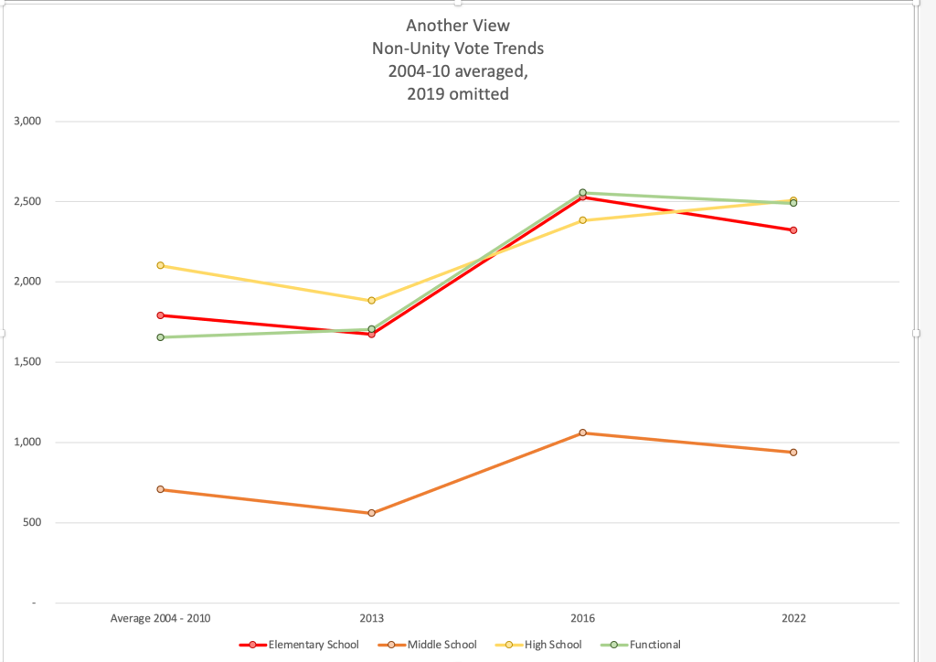
There still is an upward trend, but shallower, less clear, and with more bumps. In Elementary, for example, instead of moving from 19% to 33% (almost doubling) and only rising, we now see motion only from 1800 to 2300, with ups and downs.
Looking at votes instead of per cents does not erase all of the sense of progress, but it scales it way, way back. We cannot use this to project when the opposition will pass Unity – there’s no such clear trend. In fact, we should note that non-Unity votes fell among in-service members from 2016 to 2022.
Among all voters
It’s fine to look at the raw number of votes, as we just did. That probably gives the best picture. But a third look might be to consider what percent of members actually voted for the opposition.
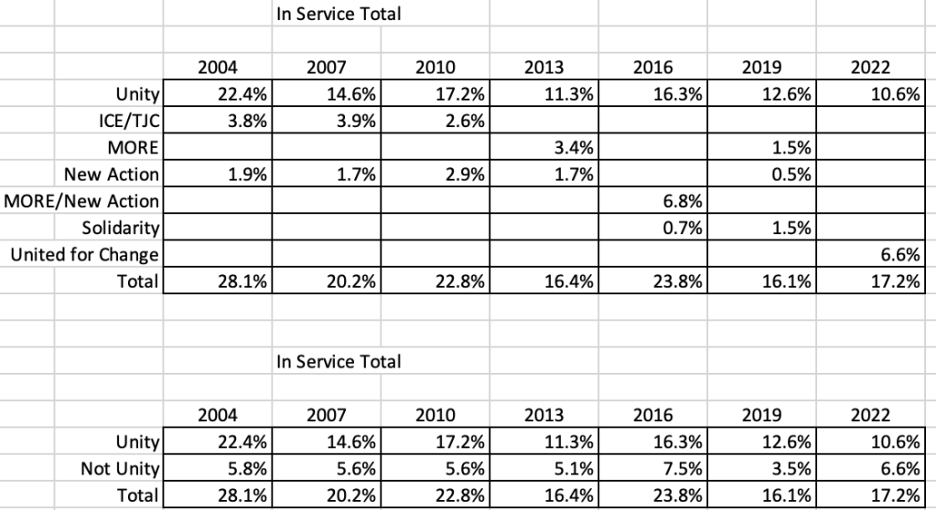
For context, I reported elsewhere that of every 34 teachers, 3 voted against Unity, 4 voted for Unity, and the other 27 did not vote. Ignore Unity for the moment – what are those historic numbers for voting non-Unity?

I should pause to note, these are slate votes only, actual votes are a bit higher. Good rule of thumb for a high estimate – add 10%. For example, middle school in 2013 says 5.2%. Add 0.5 to that and use 5.7% as your estimate. Elementary in 2016 says 7.1% – add 0.7 to that and work with 7.8% as your high estimate.
I can combine these numbers into one in-service number – we can see the Unity numbers, but it still does not look good:
This is bad for partisans of “the opposition.” But, quite obviously, it’s far worse for Unity. They may have breathed a sigh of relief over not losing more seats, but that’s the present. No relief for them as they look into the future.
Here’s the first table, now in graph form:
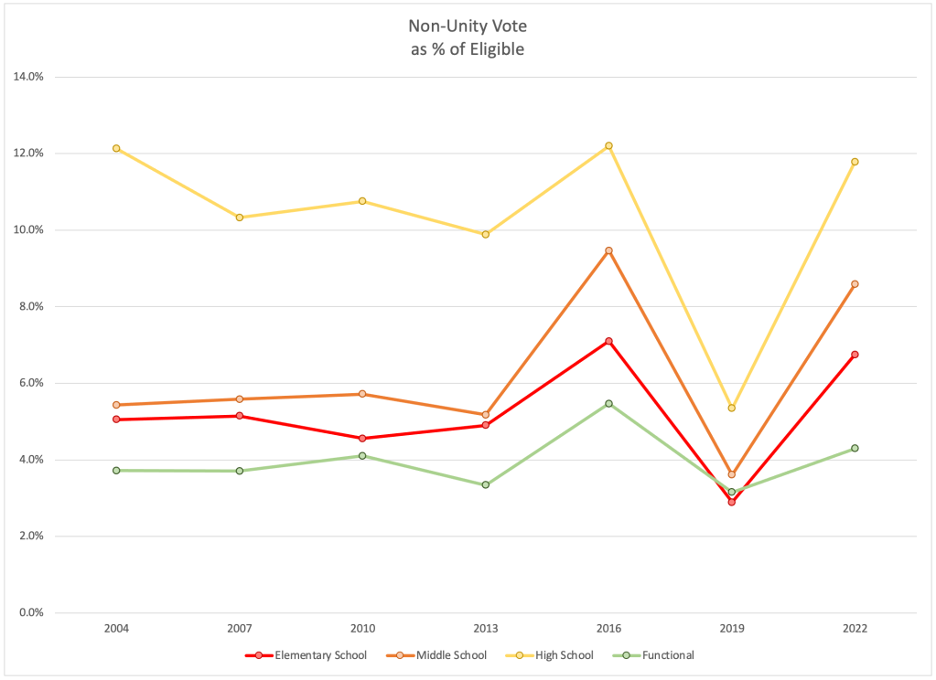
In 20 years, where’s the gain?
Even blending 2004-10 and omitting 2019, not a bright picture…

The only change that comes close to significance is in middle schools. That one requires more work/research.
And what next?
The next post in this series will be a look at what is happening to Unity’s vote. You think this was a downbeat post? it’s nothing compared to what’s happening to them.
After that? A deep look into what happened with the retiree vote – which is a very different discussion.
UFT Elections: Voting For Unity?
Unity won 66% of the total vote, just shy of two-thirds, and 58% among teachers. Those are, for Unity, not good numbers, maybe horrible numbers – the lowest since I’ve been paying attention, probably the lowest since the first decade of the UFT, and maybe the lowest in the history of the UFT. But Unity also breathed a sigh of relief – sure they lost the high schools, but they have lost the high schools many times before – and they avoided losing anywhere else.
Yesterday I looked at: Voting Against Unity?
What happens if we dig deeper into Unity’s numbers? What picture do we get? Weak performance, but they survived? Or something worse?
See also:
The 2022 United Federation of Teachers election needs a closer look.
Let’s start with the percentages (which is where the superficial analysis, above, comes from), then move on to the actual VOTES that Unity retained. Finally we will consider Unity voters as a segment of all eligible voters. I will use historical data from the last seven elections, going back to 2004. And for today I will only be looking at the four in-service divisions. The retiree vote requires a separate post.
In-service percents

And a general pattern does emerge:
- Generally down
- a small jump in 2019, but completely reversed in 2022
- 2022 is the lowest, in every division, for the past seven election cycles
Is it possible to create trend lines from this data? Sure.
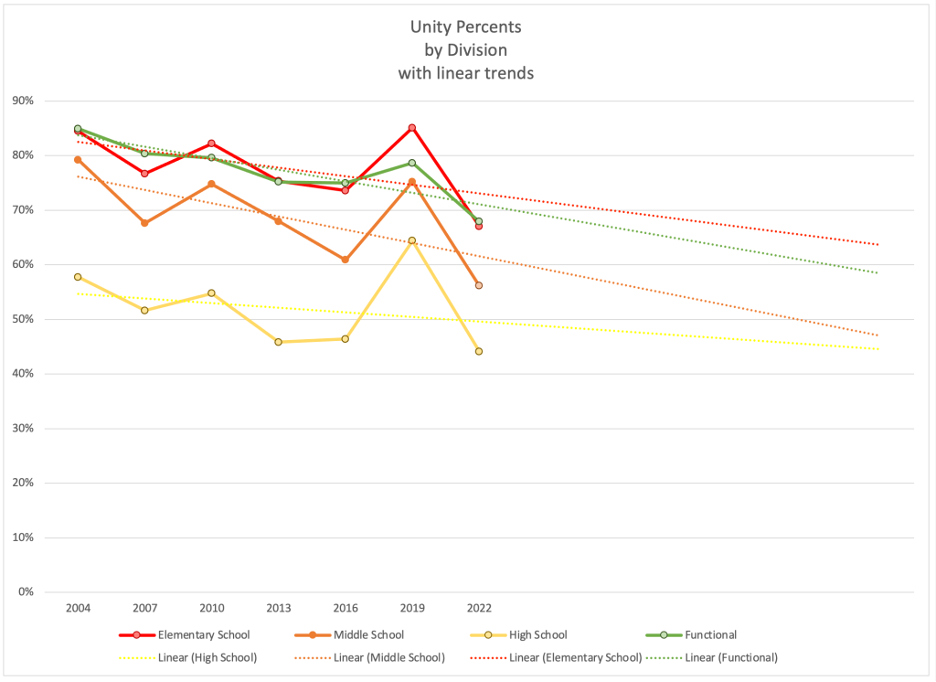
I just don’t think this is very meaningful. The end of those trend lines, by the way, are around 2040.
Could we omit 2019 to smooth the lines? Sure, but now we are forcing data to fit the story we want it to tell. This is even less meaningful, though slightly entertaining.
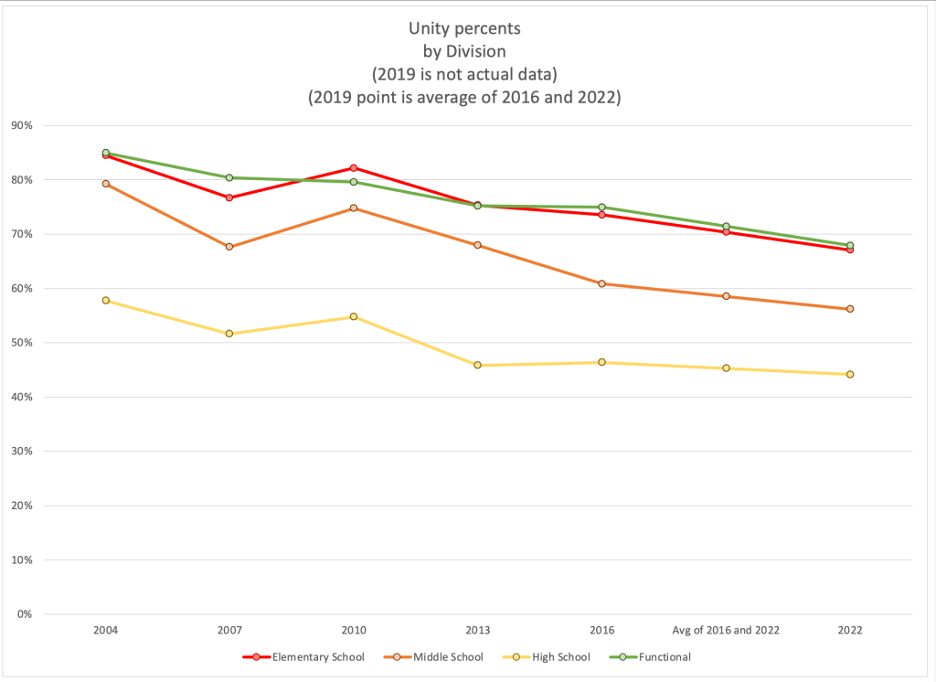
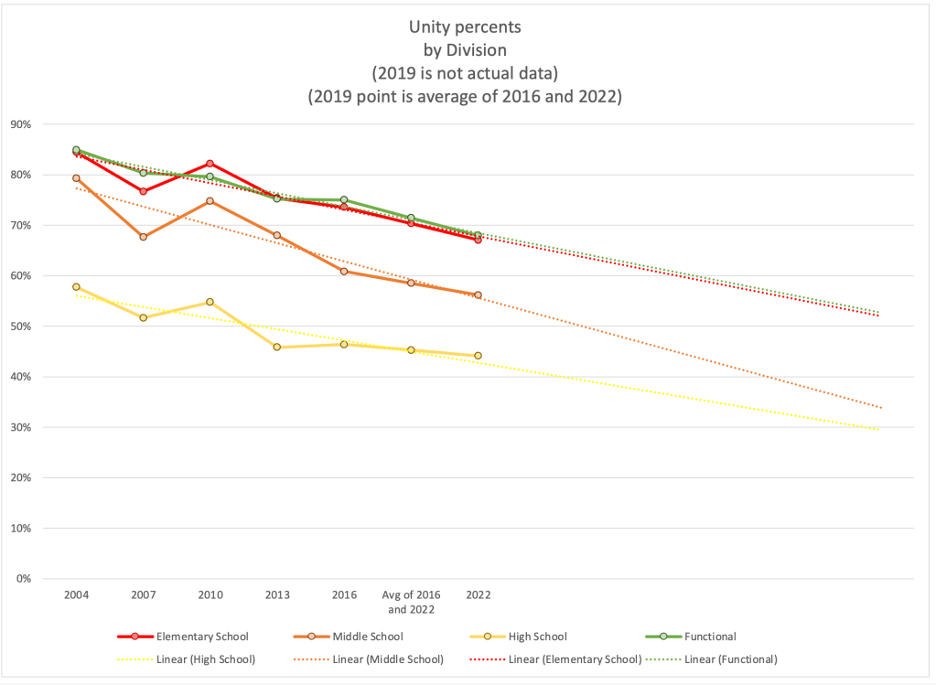
Those trendlines end in 2040 – but this is now pure fantasy. These graphs are for amusement, not for serious analysis.
For serious analysis, let’s leave out the percents, and look at actual vote totals.
In-service votes
I will demonstrate later this week that Unity and “not Unity” mostly activate or fail to activate our own votes. We generally do not trade votes back and forth (though it is quite heartening/disappointing to learn of someone who has changed sides).
(There was a significant exception in 2022 – a number of former Unity voters among the retirees did switch – but this was due to specific circumstances: the colossal Unity miscalculation around Medicare Advantage.)
This means that it makes sense to look at Unity vote totals. And these totals are more meaningful, by a lot, than looking at the percents (what we did in the section above).

In the lower two lines, Middle and High School, they seem to have hit bottom in 2013, and more or less stayed there. But in Elementary School and among Functional, Unity continues to bleed votes.
Of particular interest is Unity’s steady decline among Elementary School teachers. This election they seem to have received their fewest votes, ever, in that division. The decline in two decades is 50%. I expected the pandemic to make all of Unity’s lines drop from 2019, but the two lower lines barely slipped, and Elementary and Functional were more dramatic than I expected.
Is this due to the DoE, seemingly with Mulgrew’s acquiescence, sending Elementary staff back sooner than the older grades – with instructional lunch and no vaccines? Is this a product of what seemed to be scary-inadequate protections for staff in D75? Or is this part of Unity’s long term loss of their core voting blocs?
Here’s the same data, in table form.
And here it is, expressed as percentage of Unity’s 2004 vote totals:

Go back to the graph. Look at what is happening. Look at the table. Look at those declines. And notice, the biggest declines are not necessarily when there are big votes for other caucuses. Unity is ailing, just fine, without any help.
Among all voters
A third look might be to consider what percent of members actually voted for Unity. We know participation (turnout) is generally lousy, and getting worse. What portion of our members actually vote for the leadership? When they claim a mandate, how deep is that mandate?
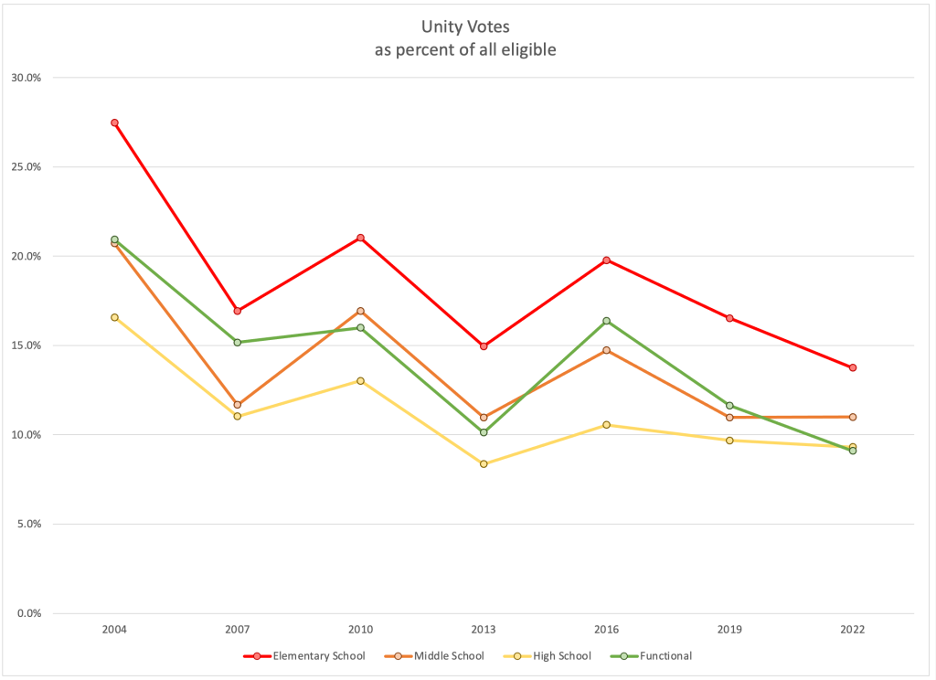
This is devastating. Unity’s longterm loss of support is consistent across the divisions. It has been around 50% over the last seven election cycles. There is no sign of any pause. And unlike 2016, when in the face of a unified MORE/New Action slate Unity actually managed to stall their decline, there is no such sign in 2022.
(Side note: the middle school numbers here are more consistent with the other divisions than in the previous section, because a significant number of middle schools have been replaced with K-8, which vote elementary, and 6-12, which vote high school. When looking at total votes, that makes it look like Unity is suffering bigger losses among middle school. When looking at votes cast divided by votes mailed, it balances out.)
Here are the numbers in a table:
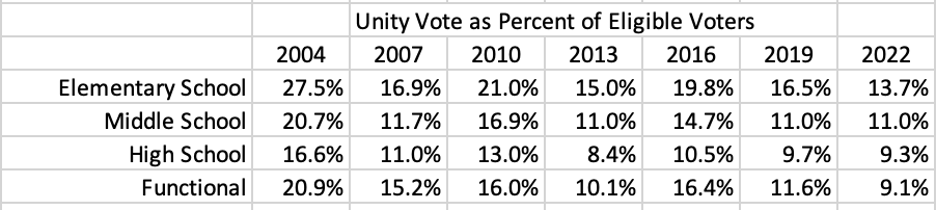
(note, these are slate numbers only. Once split ballots are added in, the totals go up, but just a bit.)
In my previous post I laid out a pretty clear case that United for Change did not have any big breakthrough among in-service members. But that seems to have had no impact on Unity – they continued their longterm decline.
That they managed to not lose more seats was unfortunate (or fortunate, for them). But that does not change the outlook – they are not doing well, and they have not been, not for a long time.
And what next?
I have been looking at vote totals, Unity and non-Unity, isolated from each other. I will lay out data that explains why this makes sense.
Something just happened among the retirees, very different from what is happening in the in-service divisions.
And then there will have to be some more digging into what is causing these changes, especially the longterm changes. There is a lot here, and that will take some time.
Finally, there needs to be a guide. Lessons learned. What steps to take next. But that part I will share privately.
Why do I look at total votes in UFT elections?
It seems obvious that we should be focused on percents. What did Unity win by? 66% to 34%. What happened in high schools? United for Change won with 56%. Unity’s 67% was a record low for them in Elementary Schools. Yet in my analysis, I have focused on total votes, not percents. Why?
See analysis at:
If Unity and the opposition were competing for the same votes, then when Unity’s votes went up, non-Unity votes would go down, and vice versa. I claim that we are fishing for votes mostly in separate ponds – and that an opposition increase and a Unity increase can happen at the same time.
Connecticut
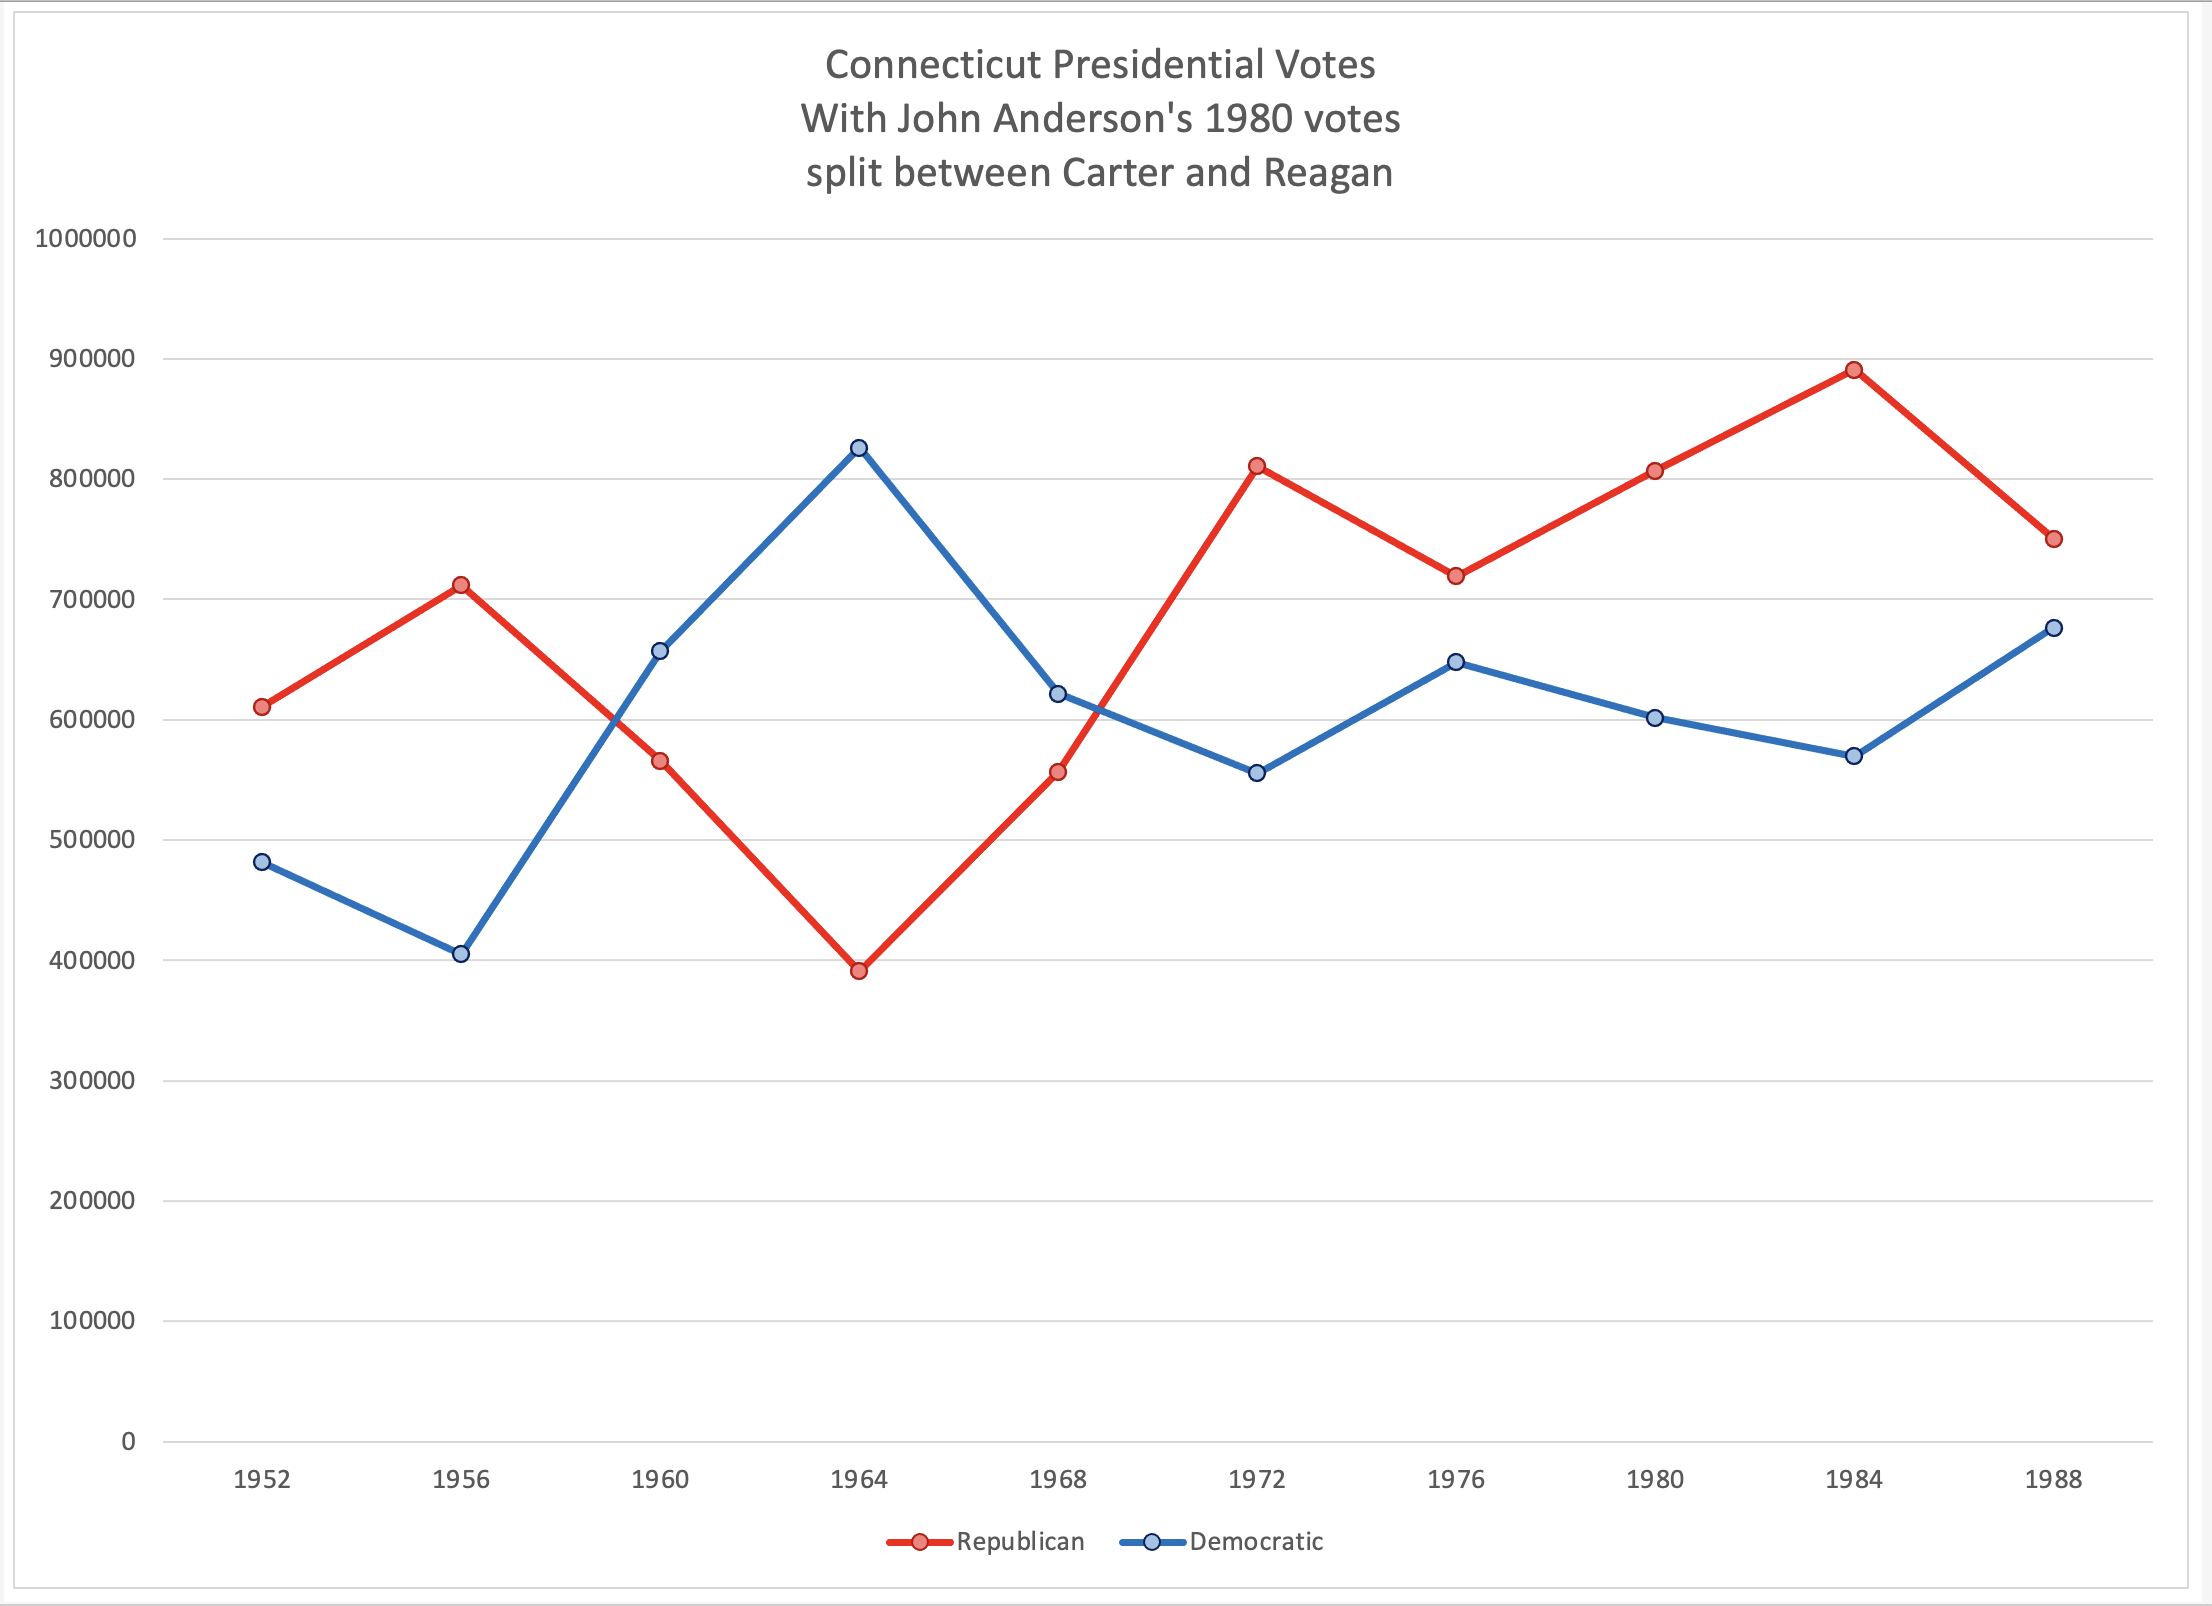
Just take a look at this pretty chart:
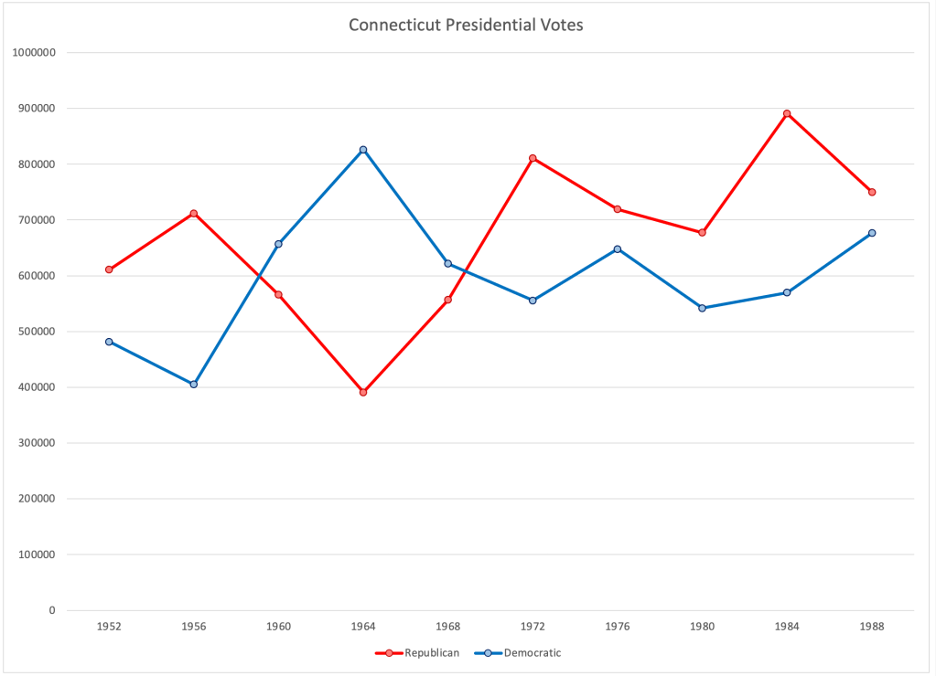
Those are Connecticut votes for president 1952 – 1988.
See the longterm upward trend? It’s there. Imagine halfway between the red and the blue. It starts around 550,000, and climbs pretty steadily to about 700,000.
Also see how the red and blue dance? When red rises, blue falls. When blue rises, red falls.
Do you see the one year that doesn’t fit? 1980. John Anderson siphoned off a bunch of votes. Raise the red dot to 810,000 and the blue to 600,000 – and there’s our pattern, clear as day:
NOT REAL
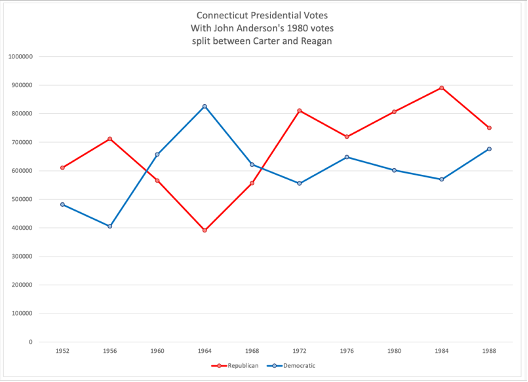
NOT REAL
That chart is not real, but only 1980 has been altered. And there it is, gentle up slope, and red goes up when blue goes down and blue goes down when red goes up. The electorate is growing, slowly, and the Democrats and Republicans are competing for the same votes.
Notice, by the way, that Connecticut used to vote pretty differently from how it votes today.
United Federation of Teachers
Do the numbers dance? Do Unity numbers rise when non-Unity numbers fall, and vice versa, or do they move independently?
Where to begin?
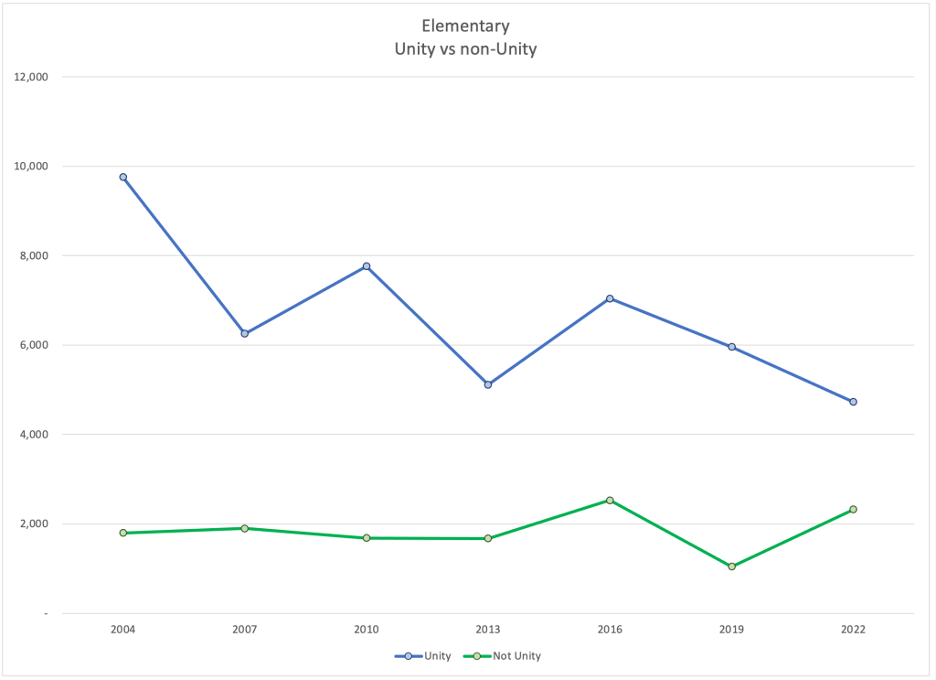
The blue line drops sharply in 2007, 2013, and 2022, but only in 2022 is there a corresponding rise in the green line. The lines rise together in 2016, fall together in 2019.
Unity and non-Unity draw votes from separate pools. This is not the Connecticut map – the lines are moving independently. They are expanding and shrinking their own bases. They are not drawing votes from each other.
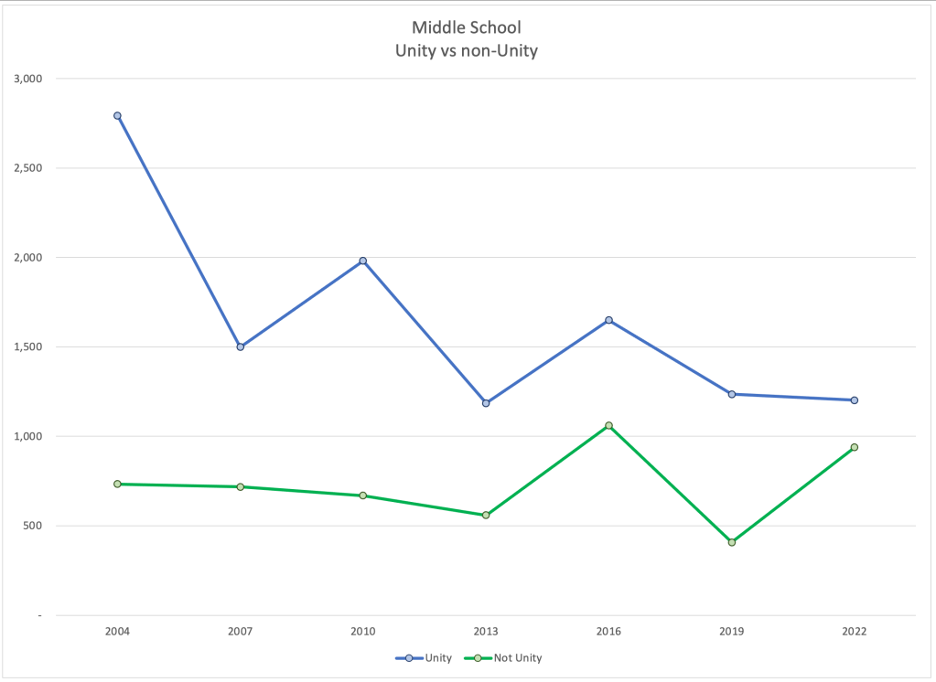
The blue and the green move in the same direction in five of the six year after year comparisons. However, in two of those Unity has a sharp fall while the non-Unity votes hold steady. There is no indication that the two sides are trading votes. They are fishing in separate ponds.
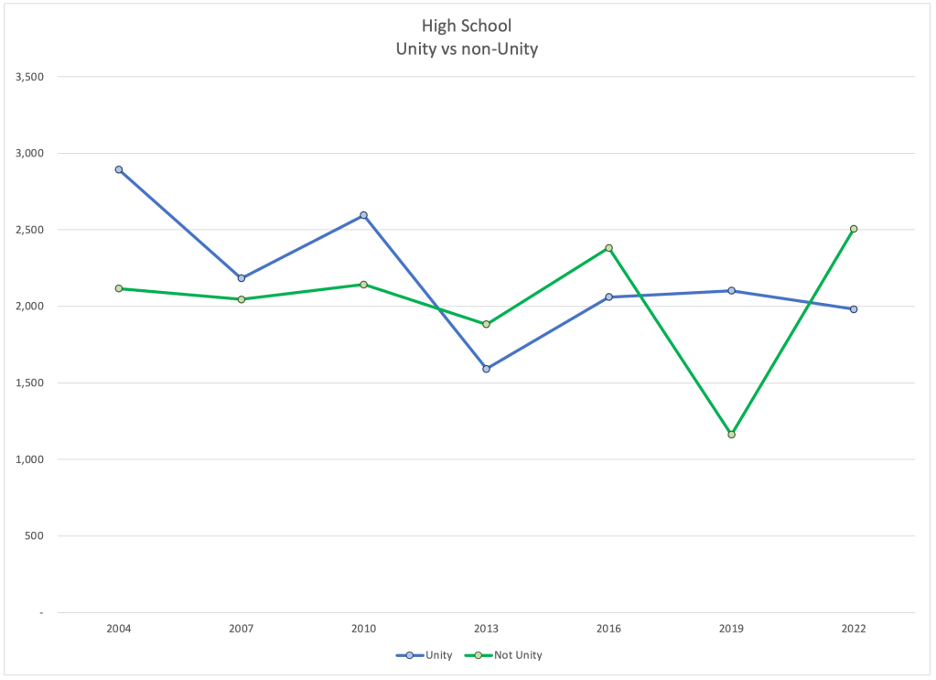
First of all, these lines almost always move in the same direction.
Second, look at the last three cycles. The opposition loses a ton of votes in 2019. Where do they go? Not to Unity. The opposition gains back a ton in 2022. Where did they get them from? Not Unity. During the same time period Unity’s votes stayed the same.
See how the lines rise together in 2016? They are not poaching each other’s votes. The only year they seem to dance, this year, the Unity fall was far greater than the non-Unity rise. This does not break the pattern.
Conclusion
Unity and the non-Unity groups are, for the most part, not directly competing for votes.
Opposition votes may or may not be cast. The struggle is getting people to vote.
Unity votes may or may not be cast. They are nearing a crisis because they cannot get their own people to vote. But their coming crisis is not being caused by the non-Unity groups; it is their failure to energize their own folks.
Analysis of 2022
Limiting the discussion to in-service, we now ask two questions: How did Unity do? How did United for Change do? We will answer each, without referring to the other.
How did Unity do?
Unity continued to lose voters across every in-service division. They may be leveling out in high schools. We would need more evidence to support that. But it is possible that they have hit rock bottom in this division.
How did United for Change do?
United for Change recovered from the separate caucus’ very weak showing in 2019 – but not to the level of 2016. It is not a bad election, but nor is it a major breakthrough.
Next up: analysis of retiree voting.
The Retiree Vote
The May results from the United Federation of Teachers elections seem clear:
- Unity won overall, but with a lower percent than in the past
- The united opposition won the high schools (not a big surprise) and came fairly close in the middle schools (not a big surprise for me, but it may have been for others).
Analysis of in-service vote totals also seems clear:
- Unity lost votes. This continues a clear and dramatic two decade trend
- The united opposition did almost, but not quite as well as MORE and New Action did two elections previous.
- Unity and the opposition do not directly compete for votes. Rather, each side struggles to engage their own potential voters.
Retirees
But I have intentionally set aside the retiree vote. It is more complicated in 2022. There’s a few structural reasons:
- Retirees are not involved in day to day union decisions. They are not (for the most part) in schools or classrooms. Arguments about MOSL or mayoral control are, for the most part, do not move retirees.
- Retirees (I strongly believe) continue to vote or not vote, according to whether they voted or did not vote in the last election before they retired. (Turnout among retirees is inelastic.)
- Retirees who vote continue to vote for the same group they voted for before they retired. (Preference among retirees is not elastic.)
- The retiree voting pool shifts differently than in-service members. I will in the near future retire. I will join the Retired Teachers Chapter (RTC). I will start voting in UFT elections, probably as I have voted in past elections. And at some point, I hope several decades in the future, I will pass on.
There’s also more data:
- There are retiree-wide elections in addition to the UFT’s general elections – the Retired Teacher Chapter (RTC) holds a full slate vote the spring before. I have data from 2018 and 2021.
And there’s something new for 2021-2022, the eight-hundred pound gorilla that Unity let into the room:
- Medicare. Medicare Advantage. Medicare Advantage Plus. Mulgrewcare. For the first time – perhaps ever – there was an issue on the table that moved retirees.
The Data
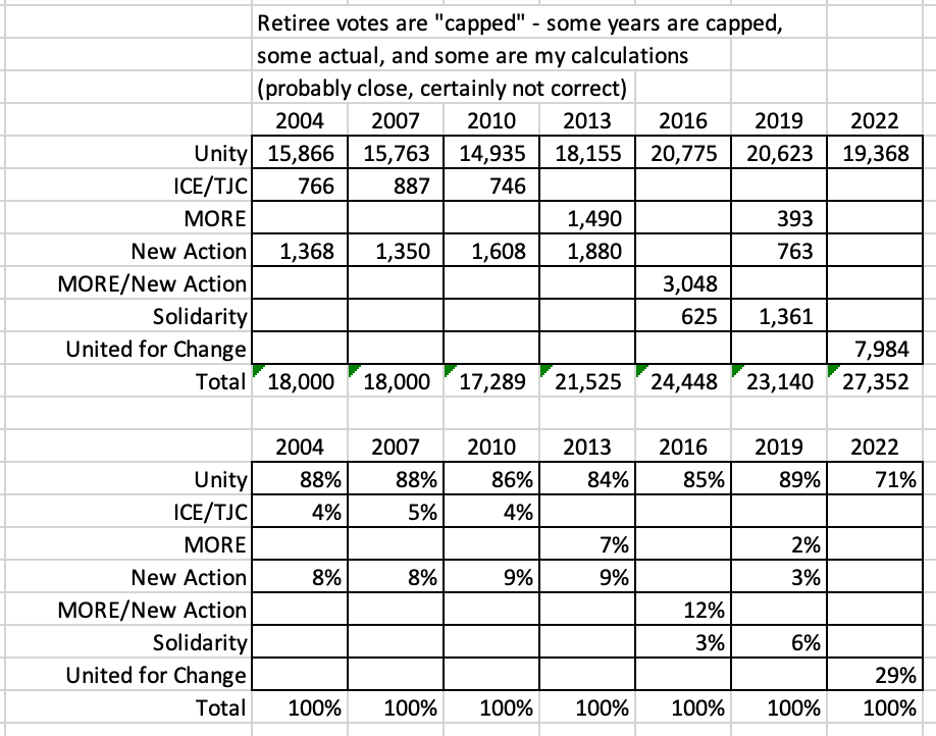
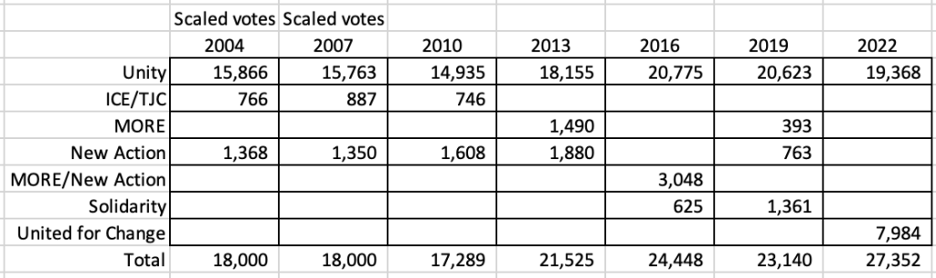
A note: Retiree votes are “capped” by the UFT Constitution. It is weird (it is) that members who are not in-service have such a large say over what happens to members in service. Conversely, when there are big retiree issues – which are rare – but Medicare! – that’s when retirees should have much more of a say. In any case, even the writers of the UFT constitution (Unity) know it would look weird for retirees to dominate the voting. So they created a “cap.” Up through 2010, if retiree votes exceeded 18,000, then they would be scaled down to 18,000. Unity, which we think of as having a “lock” on retiree votes, raised the cap to 23,500 for the 2013 election.
For 2004 and 2007 I have the vote totals after the cap was applied. That means that the percentages are correct, but the raw numbers were proportionately a bit higher.
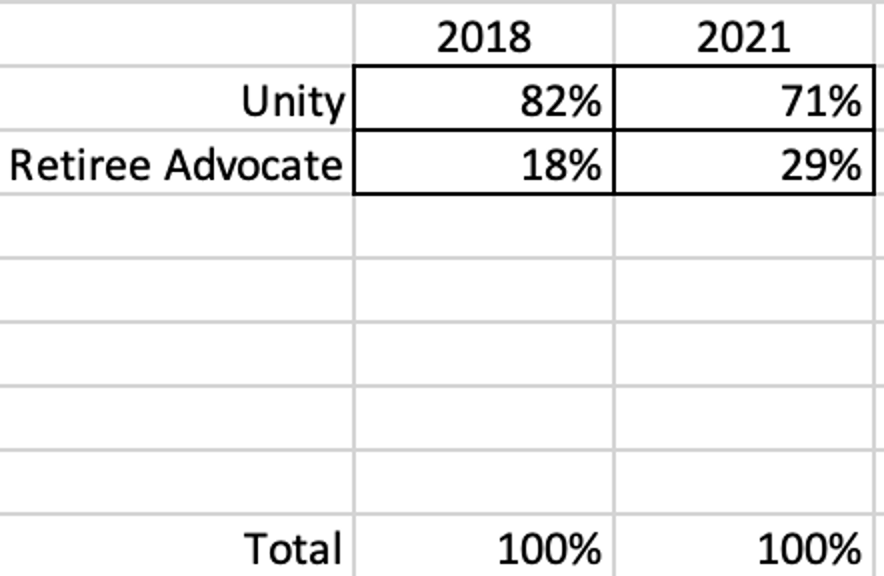
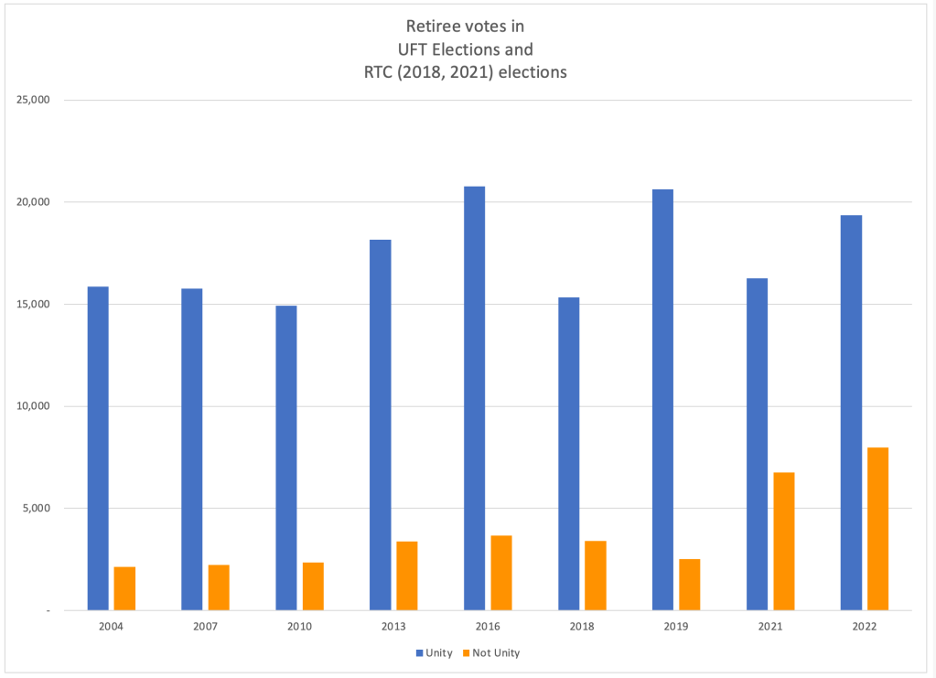
Here’s the percents:
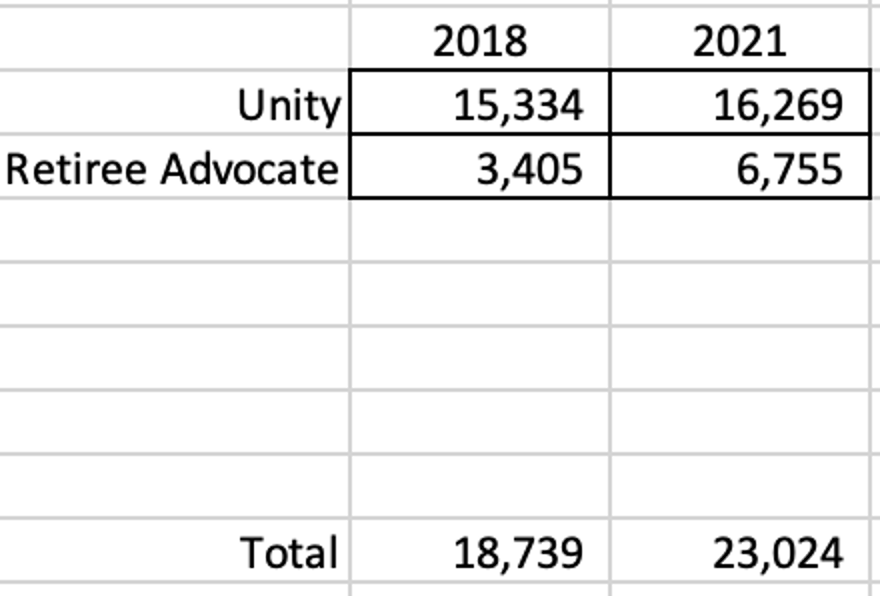
Here’s the numbers (remember 2004 and 2007 I have scaled, not actual)
And here are the RTC 2018 and 2021 numbers and per cents:
The graph initially looks a bit of a jumble:
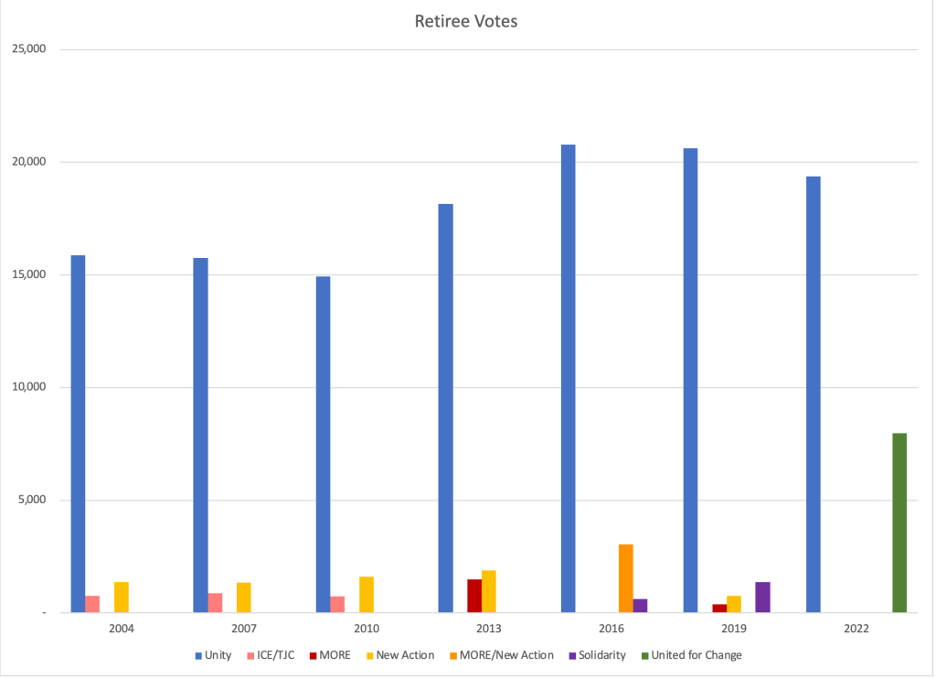
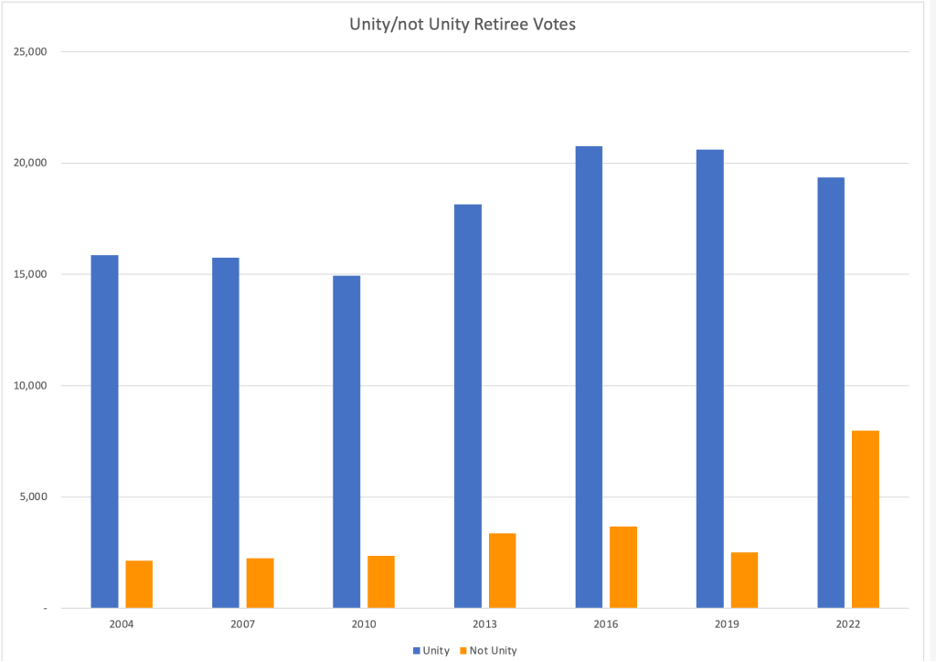
By combining all non-Unity votes, things smooth out. We have 6 stable cycles.
Including the RTC numbers makes it look like there are jumps – but really it’s just that turnout is a bit lower for RTC elections. (although not that much lower)
Since there is overall stability, looking at percents is not misleading.
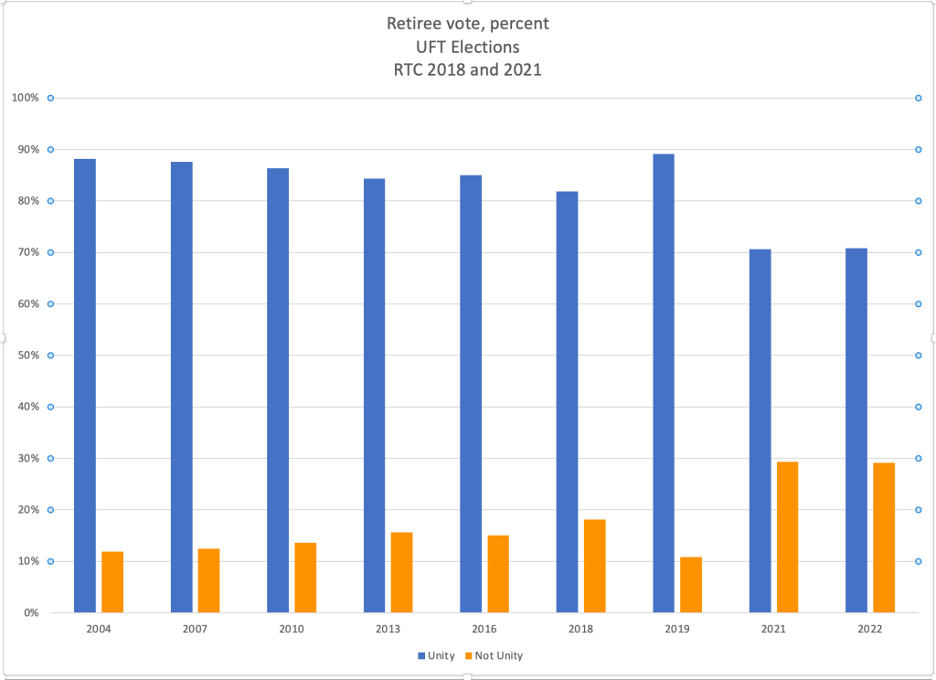
In fact now we see what we thought: Unity has won 82% – 89% of the retiree vote, until now. And they have usually been in the upper half of that range. They fell to 70-71 when the Medicare Advantage Plan was announced. They lost votes in the RTC election that Spring. Retiree Advocate members said that word had barely gotten out, and expected another jump this election. That didn’t happen. News about Medicare had an immediate impact on retirees who heard about it, and we seem to have seen most of that shift immediately, in the RTC 2021 election.
A little refinement: Since we have two RTC elections’ worth of data, can that be analyzed? It’s not really enough for deep analysis. But after the 2018 RTC, Unity vote rose 34% and after 2021 it only rose 19%. That’s about 2500 missing votes. So there is some additional underperformance on the Unity side in 2022 that this chart does not capture.
Some Guesses
What does it mean? I see Unity having “lost” 2600 votes in the RTC election in 2021, and another 1000 in this Spring’s election. United for Change/Retiree Advocate seems to have picked up about 3000 votes in the 2021 RTC election, and another 1000 or so this Spring.
Unlike the other divisions, there were a significant number of retirees who switched sides. There are also Unity voters who chose not to vote. And there were first time voters who voted for Retiree Advocate or UfC (and against Unity). I do not think there is enough evidence in the numbers to know how many Unity voters sat it out, how many switched sides, and how many votes RA/UfC picked up that were new voters, and how many we captured from Unity.
As a guess? Retiree Advocate and United for Change may have pulled in 2000 new votes, and taken 2000 votes from former Unity voters. Unity may have had about 1600 who did not send in ballots. Or it could be 1000 new and 3000 switches, with 600 Unity voters not voting. It’s hard to know without more data. Anecdotally, I know a significant number of first time voters voting for United for Change, and I know over a dozen former Unity voters who first time voted against Unity. I only know 2 Unity voters who did not vote. But my sample? These are people I know. Not a random sample.
Medicare Advantage – Lasting Impact?
More data, which will come with future elections, may reveal more of the picture. Future elections will also help us understand how permanent these changes are. Will retirees drift back to Unity? Or has their faith in the leadership been not only shaken, but broken?
For over a generation UFT retirees have not been strongly motivated to vote. What Bloomberg did to the schools did not affect retirees. Those with a strong political agenda – perhaps aligned with New Action, voted that way. Those with connections – perhaps a current or former job, or deep friendships and relationships within Unity, voted that way. But the understanding, the deal – retirees did not have to worry because the union would forever protect their pensions and their healthcare – that deal seems to have been broken.
Can Unity drop Medicare Advantage Plus, and convince retirees that this was all a misunderstanding? Can Unity force Medicare Advantage through, and will retirees find that the cuts are not so bad? (I can’t see that happening). Is there a way for Unity to win back the trust they violated? Those questions remain open.

