UFT Elections: Voting Against Unity
United for Change won 34% of the total vote, and 42% among teachers. Fairly impressive. But how many VOTES did United for Change win? In an environment of declining turnout, do those percentages represent real gains? Or something else?
See also:
Let’s look first at the percentages, and then at the vote totals. Finally we will consider non-voters. I will use historical data from the last seven elections, going back to 2004. And for today I will only be looking at the four in-service divisions. The retiree vote requires a separate post.
In-service percents
Calling anything an “opposition total” would be at least a little controversial. New Action’s votes from 2004-2013 went to Unity’s presidential candidate. Yet those voters chose to vote for hundreds of New Action candidates, and were declining to check “Unity” on the front of the ballot. I was quite hostile to Solidarity in 2016 and 2019. Yet it makes sense to combine all the non-Unity votes to get an idea of what was going on. So I’m just lumping them together as “Non-Unity.”
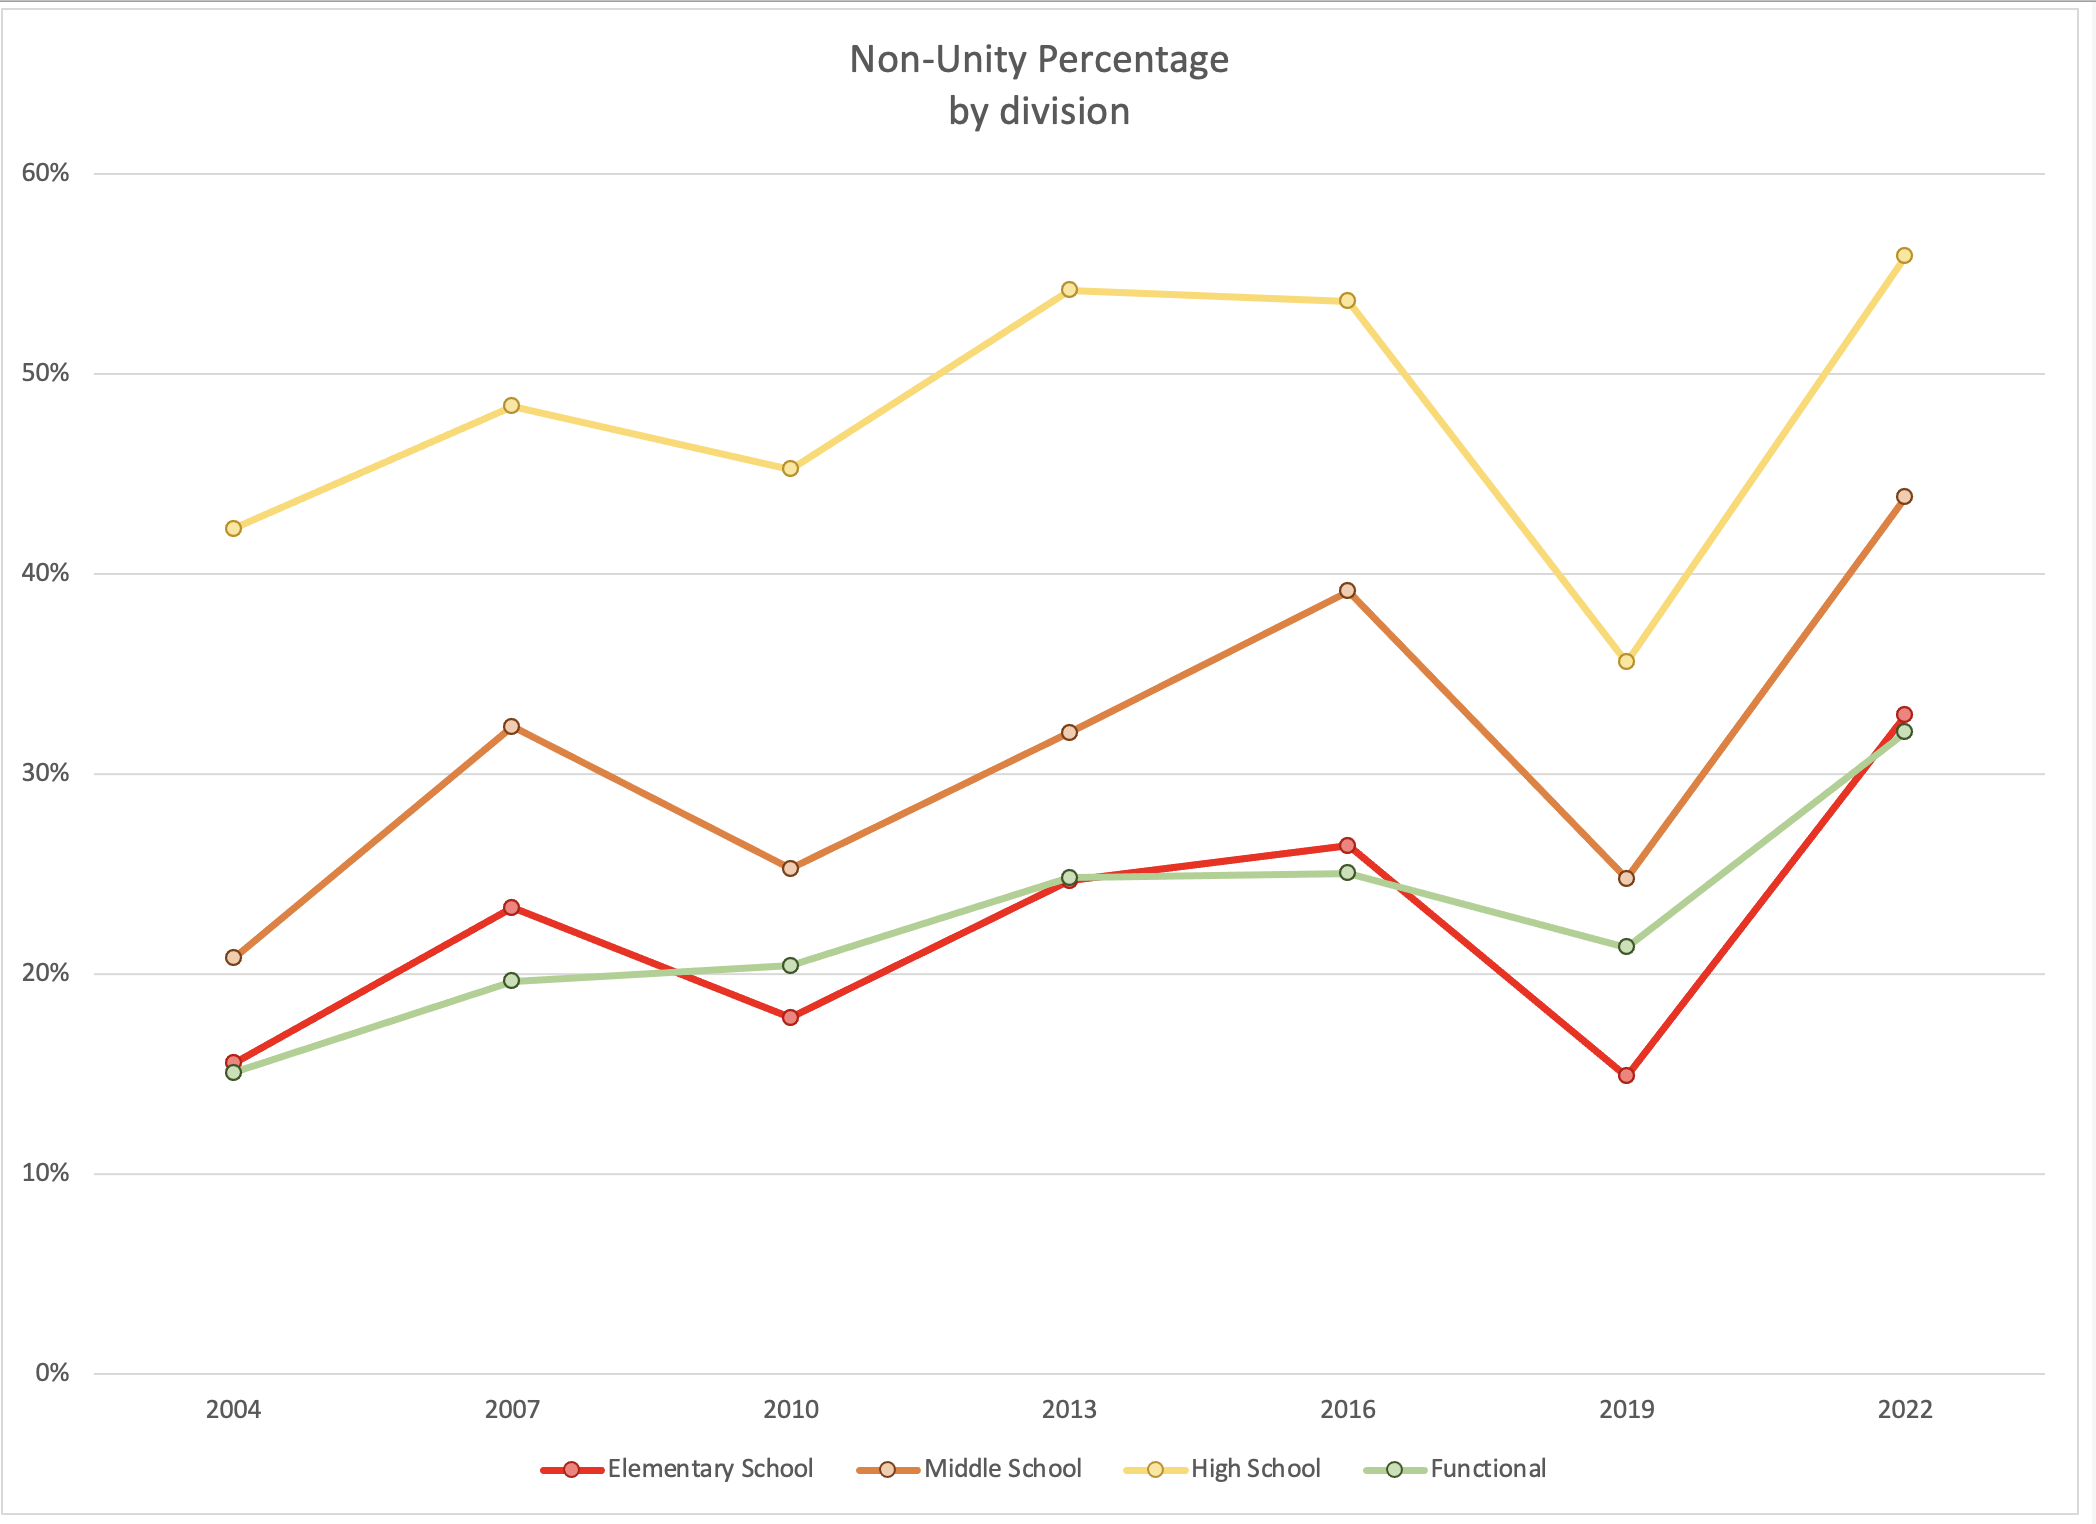
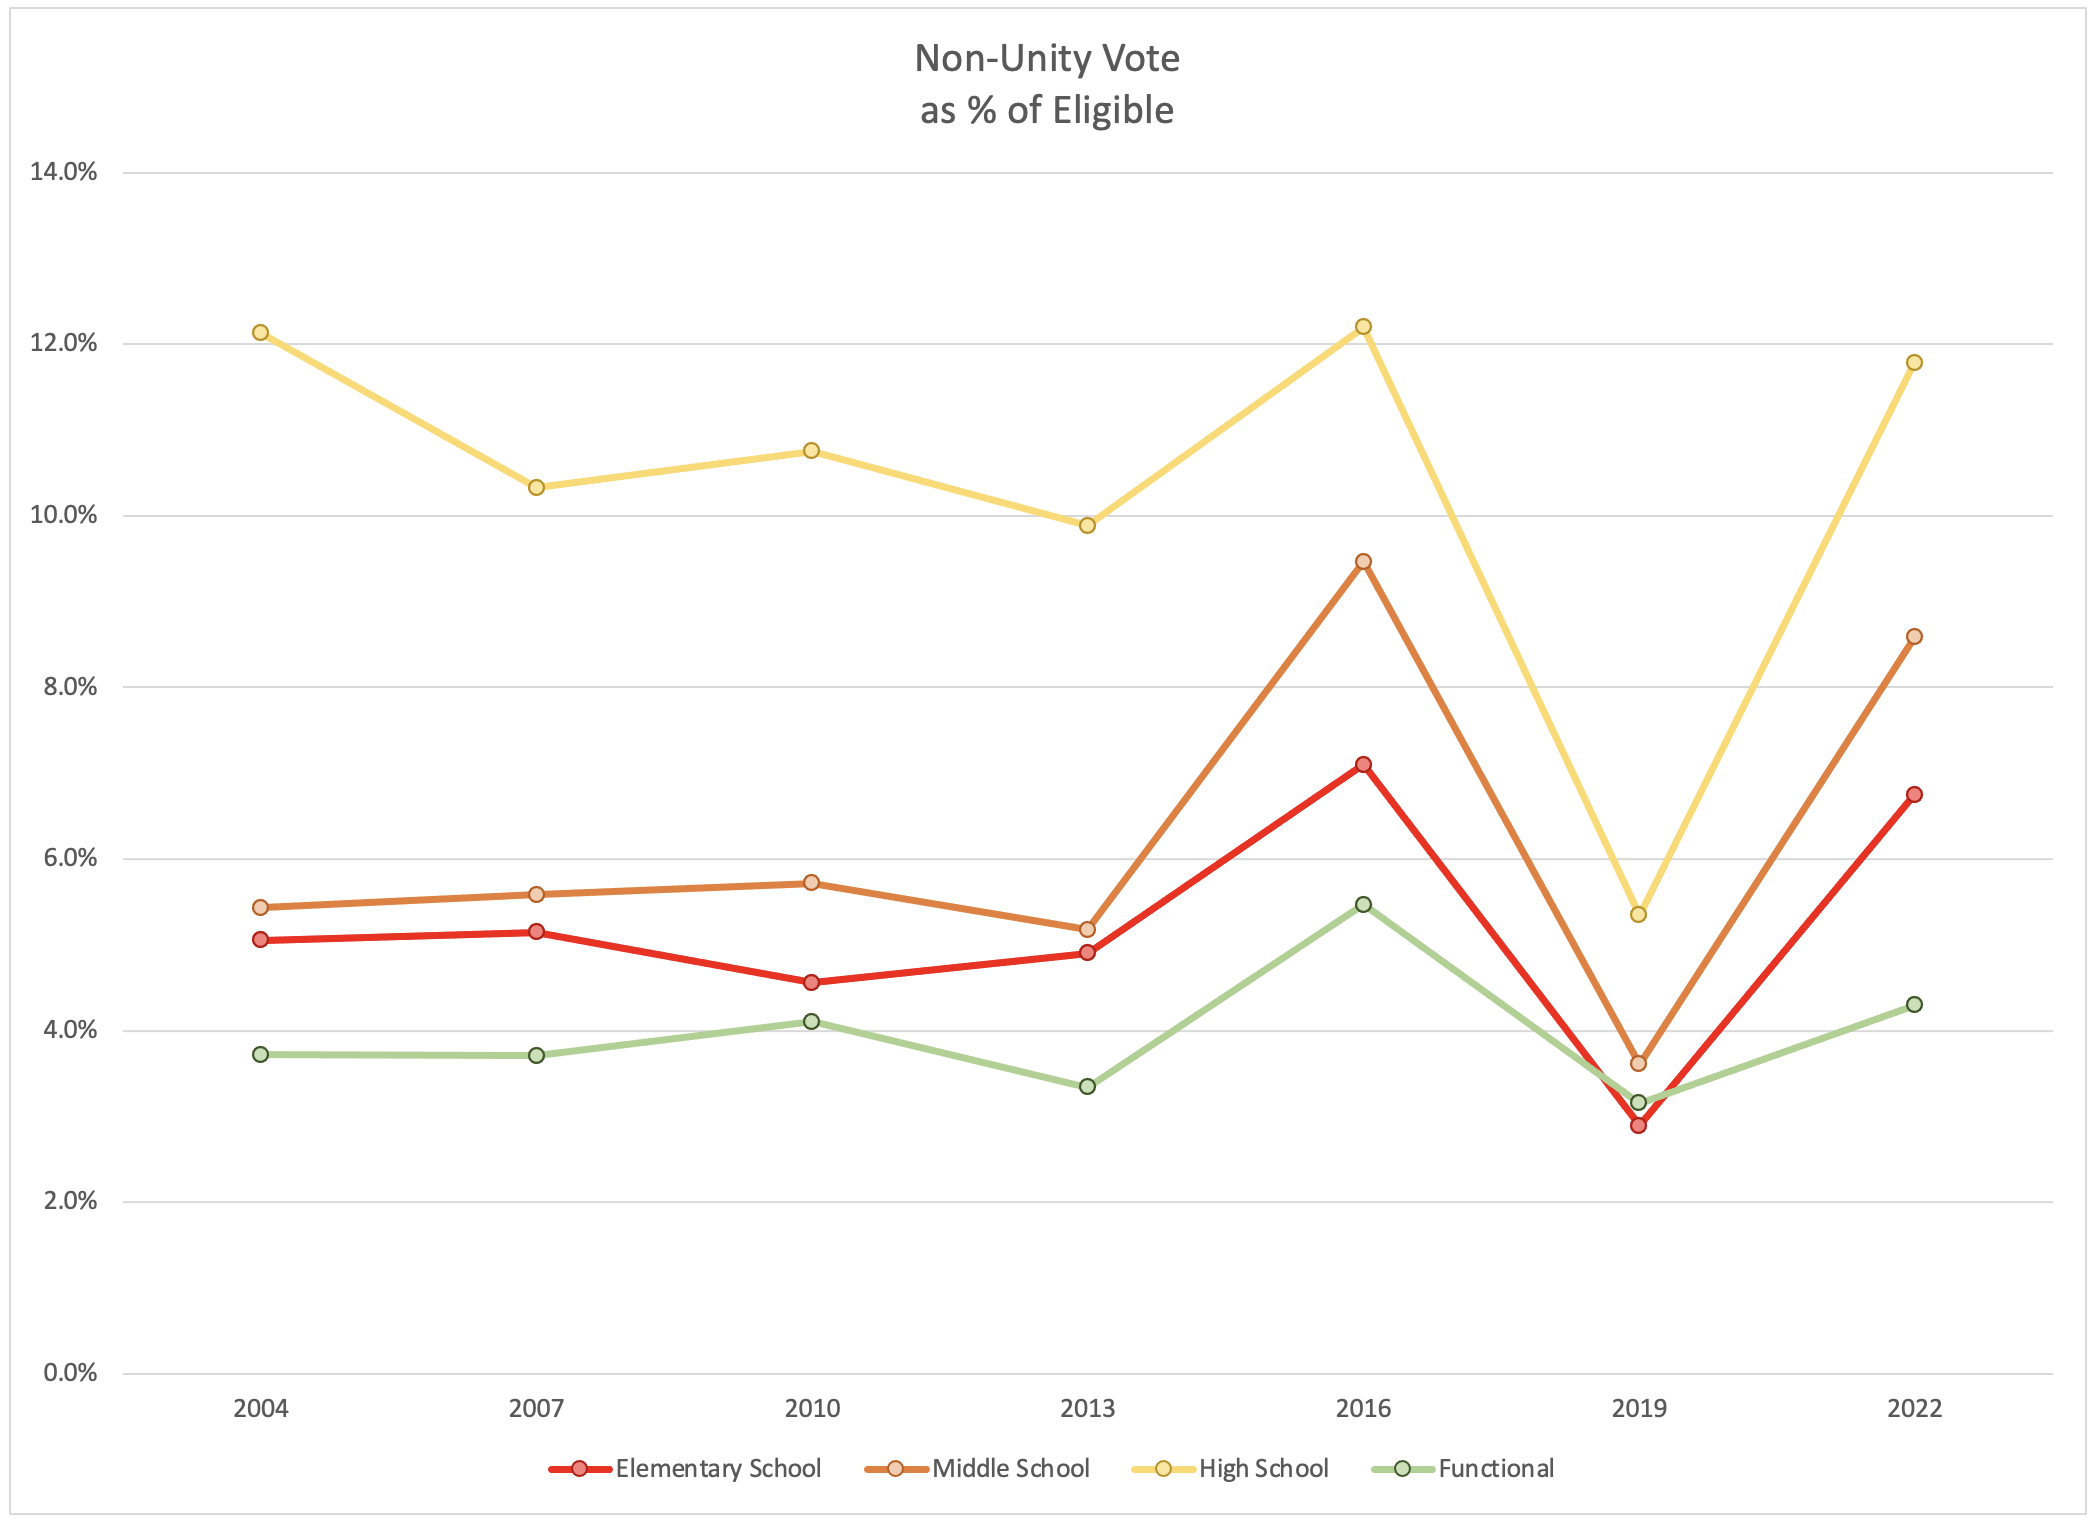
And a general pattern does emerge:
- relative stability 2004 – 2010
- a small jump in 2013 (most impressive in high schools, least impressive in middle schools)
- another, smaller jump in 2016 (actual dip in high schools, most impressive in middle schools, balancing out 2013)
- big drop in 2019
- return in 2022 to an increase on 2016.
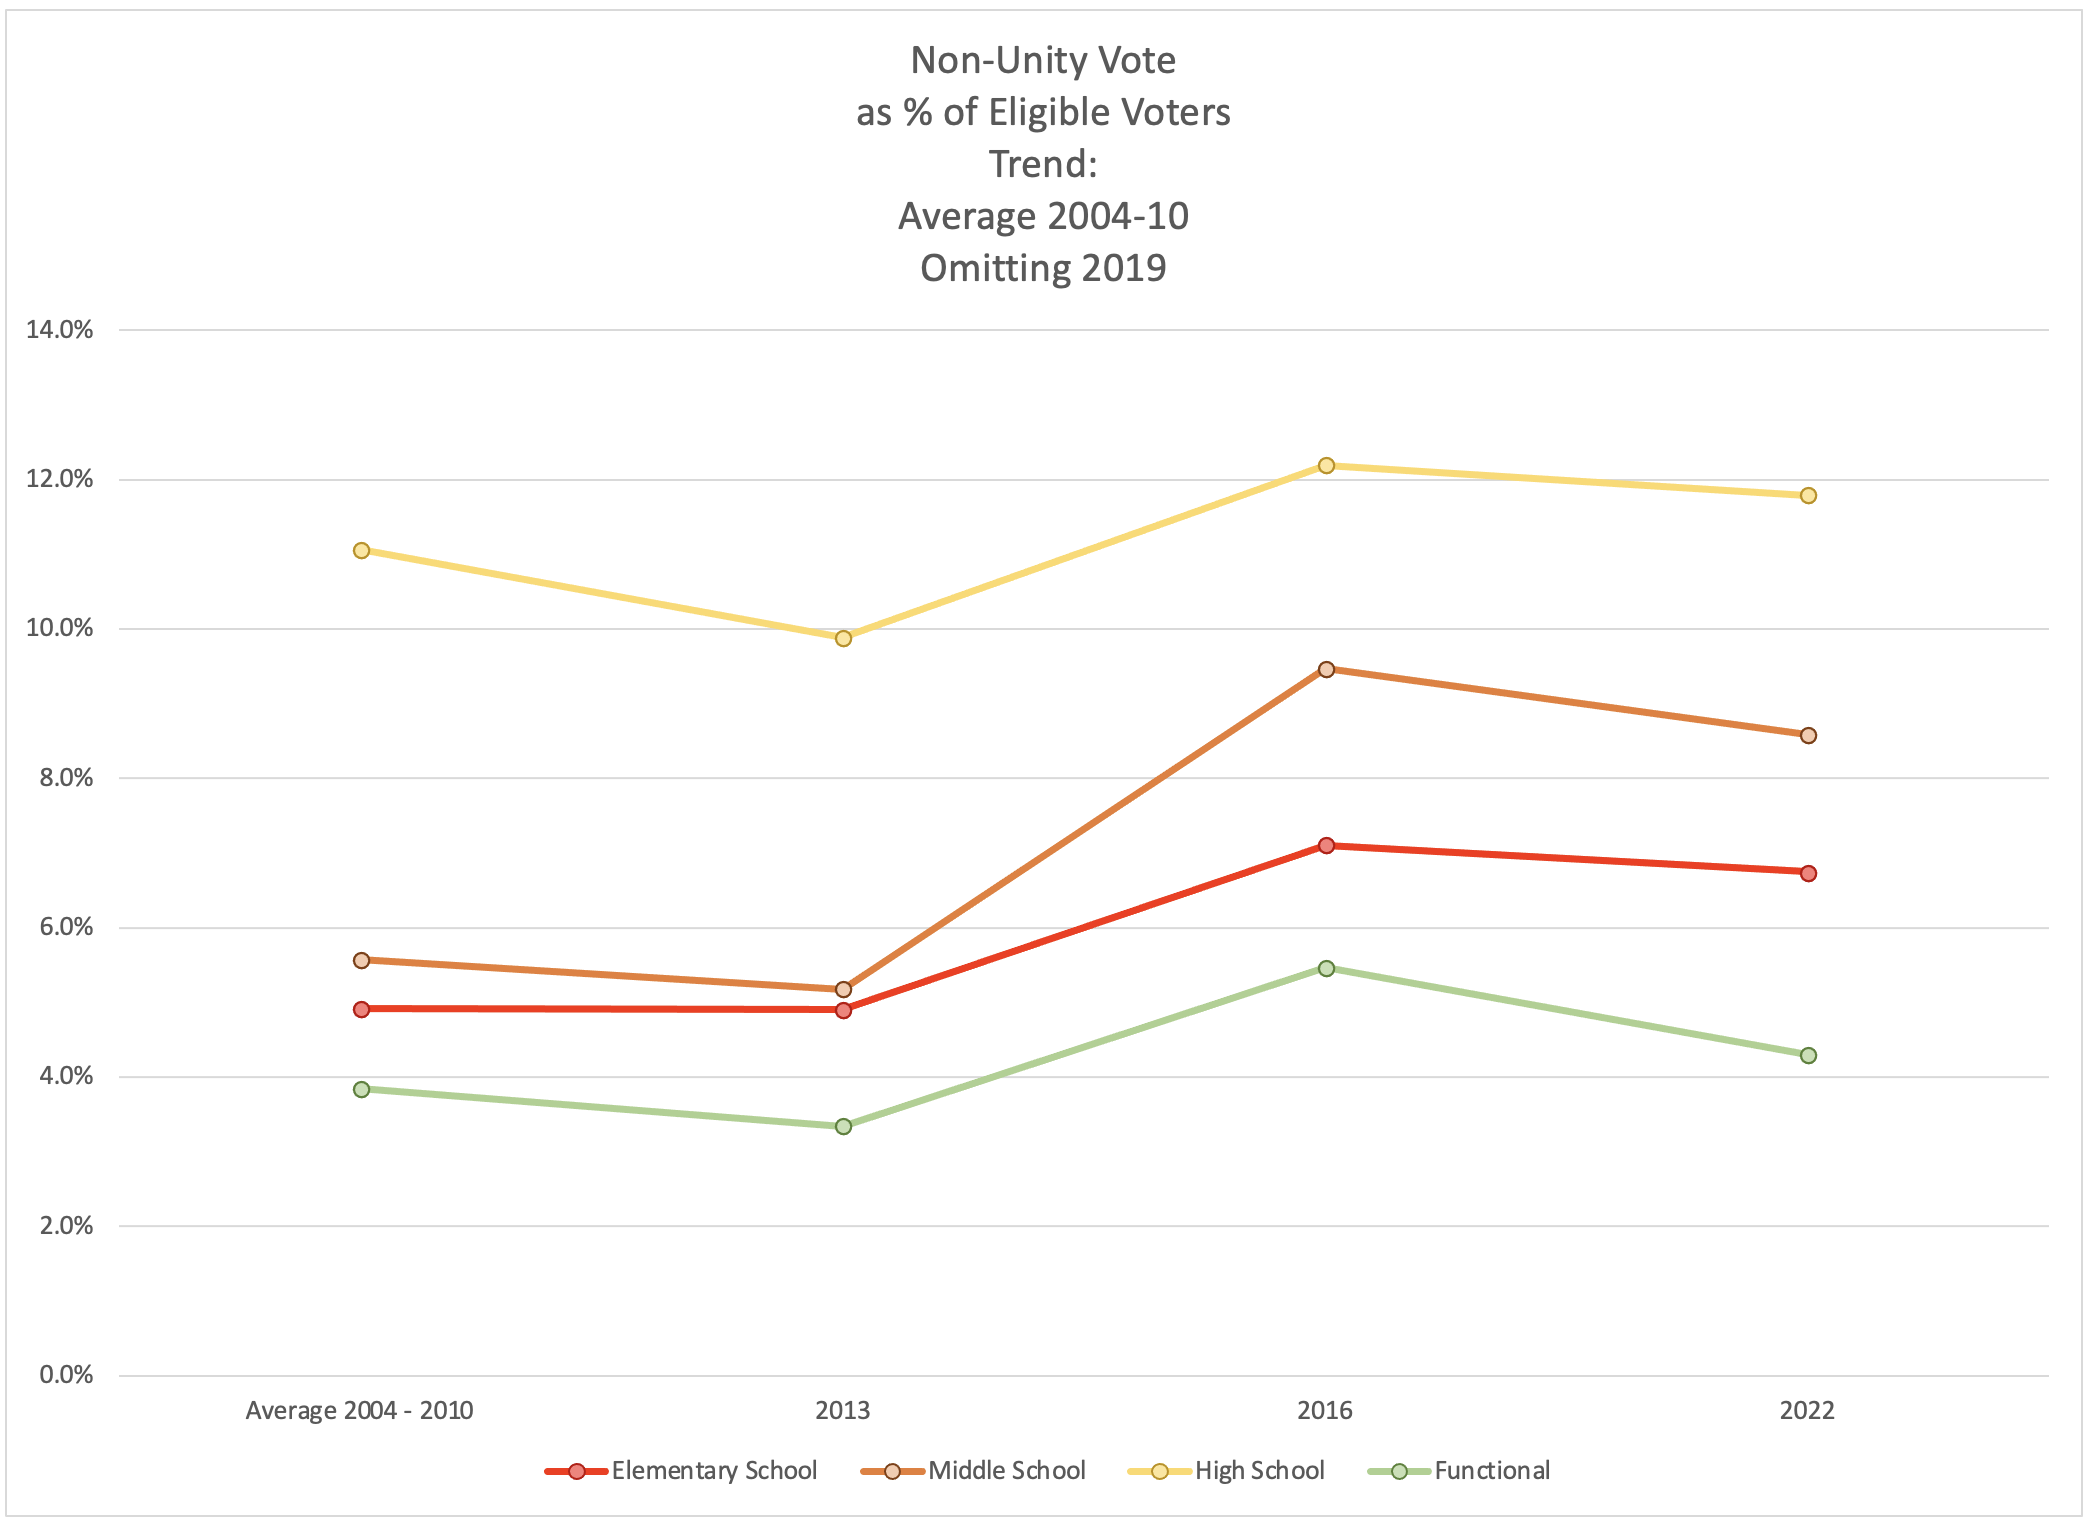
Imagine that 2019 didn’t happen – do we have a straight line of increases from the averages of 2004-10, through 2013, 2016 (skipping 2019) to 2022? Take a look:
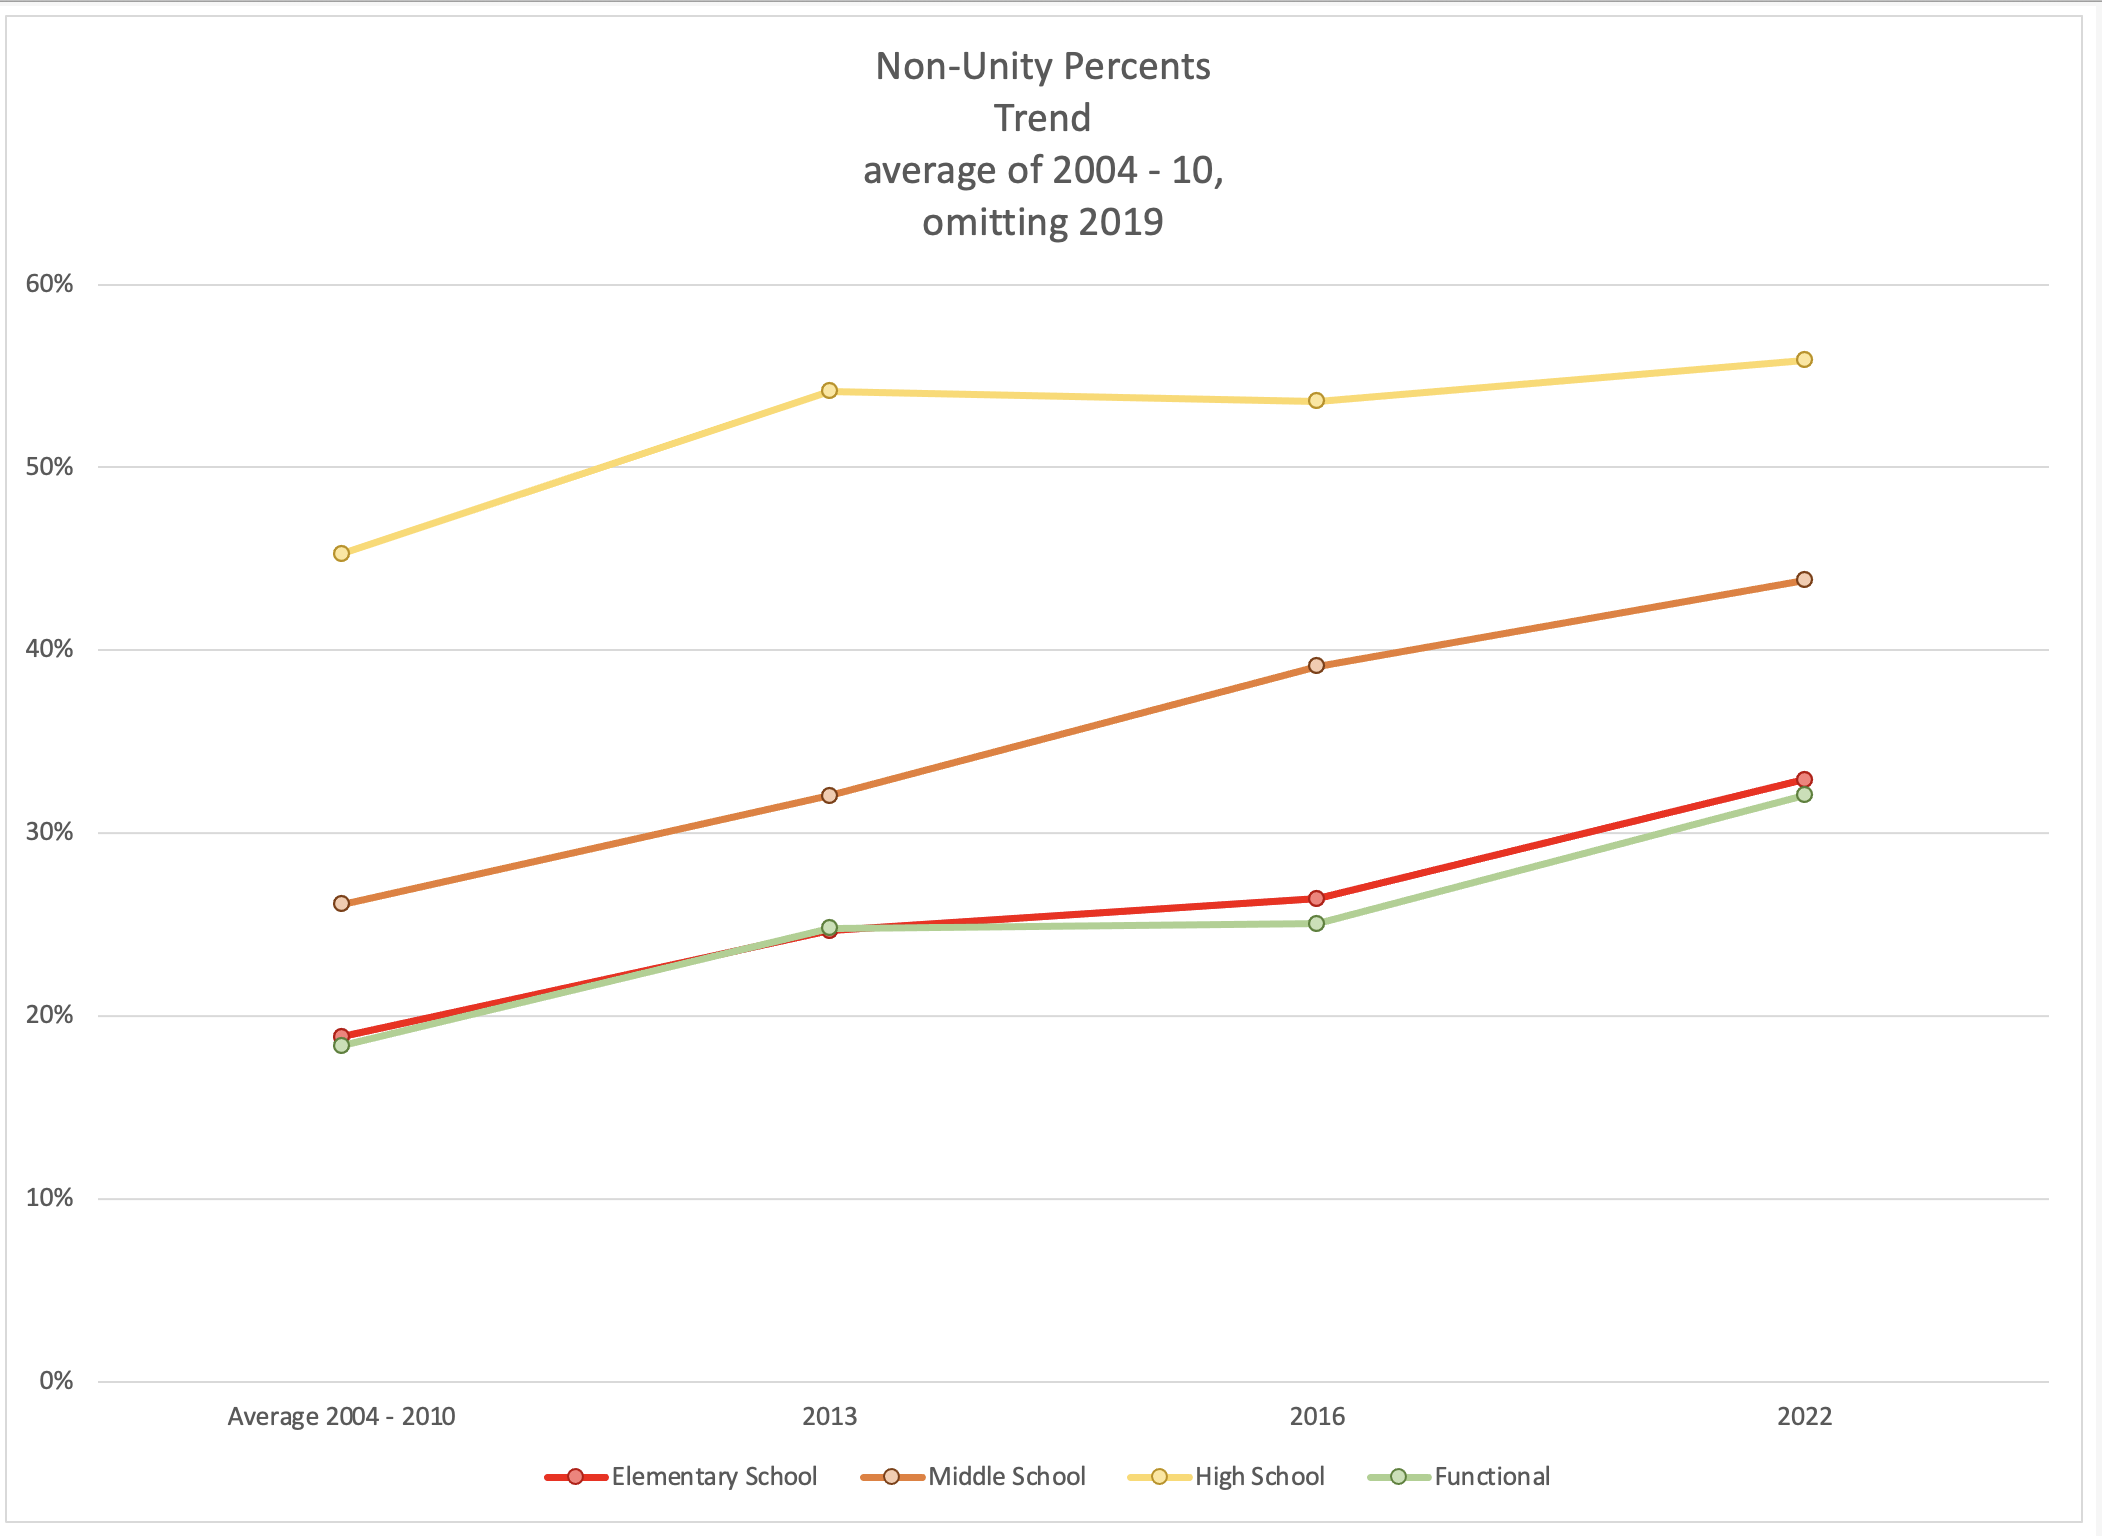
Is this a picture of steady progress? Is “the opposition” inexorably moving forward? Should we project the year “the opposition” overcomes Unity? (2025 in middle school? 2028 or 2031 among functionals and in elementary schools?) That looks very tempting. But this is the wrong graph.
In-service votes
Let’s look at in-service votes that went to opposition groups. I claim this is a better representation of how the opposition groups are doing. The percents measure us versus Unity, but that is not how voting in the low-turnout UFT works.
Do we struggle FOR the same votes? I would argue, mostly, no. Despite the bickering on Twitter and FaceBook, most of those who participate in those scrums have already made up their minds. We lose and gain relatively few votes by winning people over from the other side (as much as we are delighted when that happens. And it did happen a bit this election, but among retirees).
We might struggle to “get out the vote.” Unity does, too. But we are working in essentially separate universes. Most of our gains or losses involve people choosing to vote, or choosing not to vote.
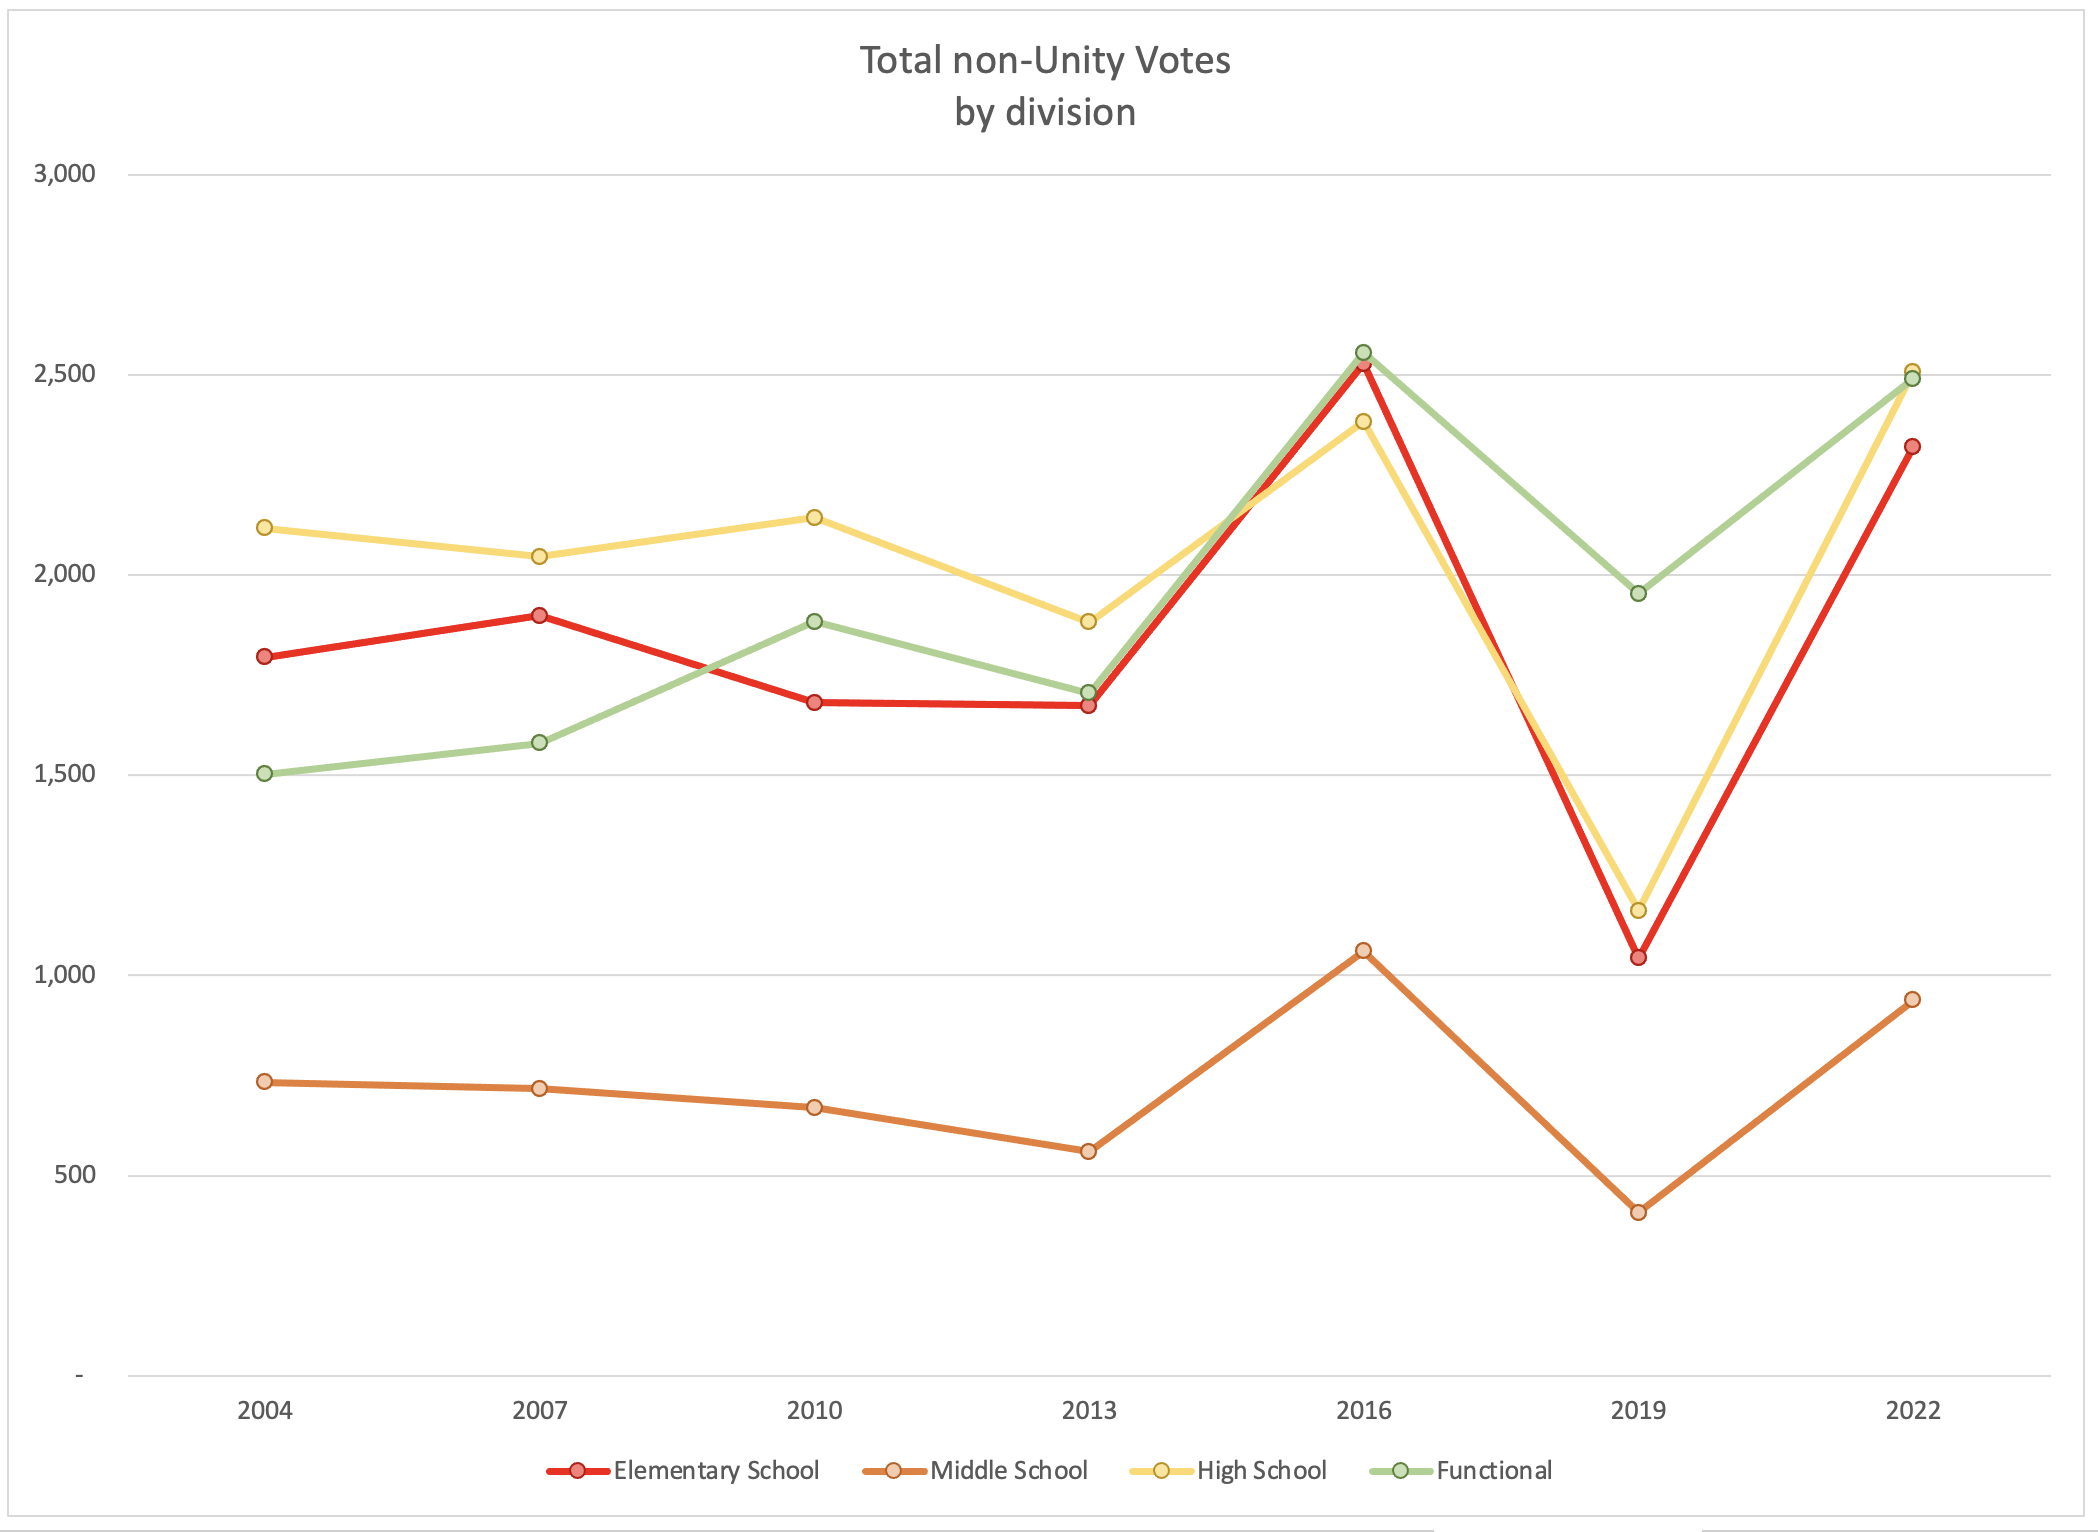
There are still ups and downs when we look at the votes, rather than the percents. But the pattern is not so clear.
Let me narrow the data again, looking for a deeper trend. Same as above, imagine that 2019 didn’t happen – do we have a straight line of increases from the averages of 2004-10, through 2013, 2016 (skipping 2019) to 2022? Take a look:
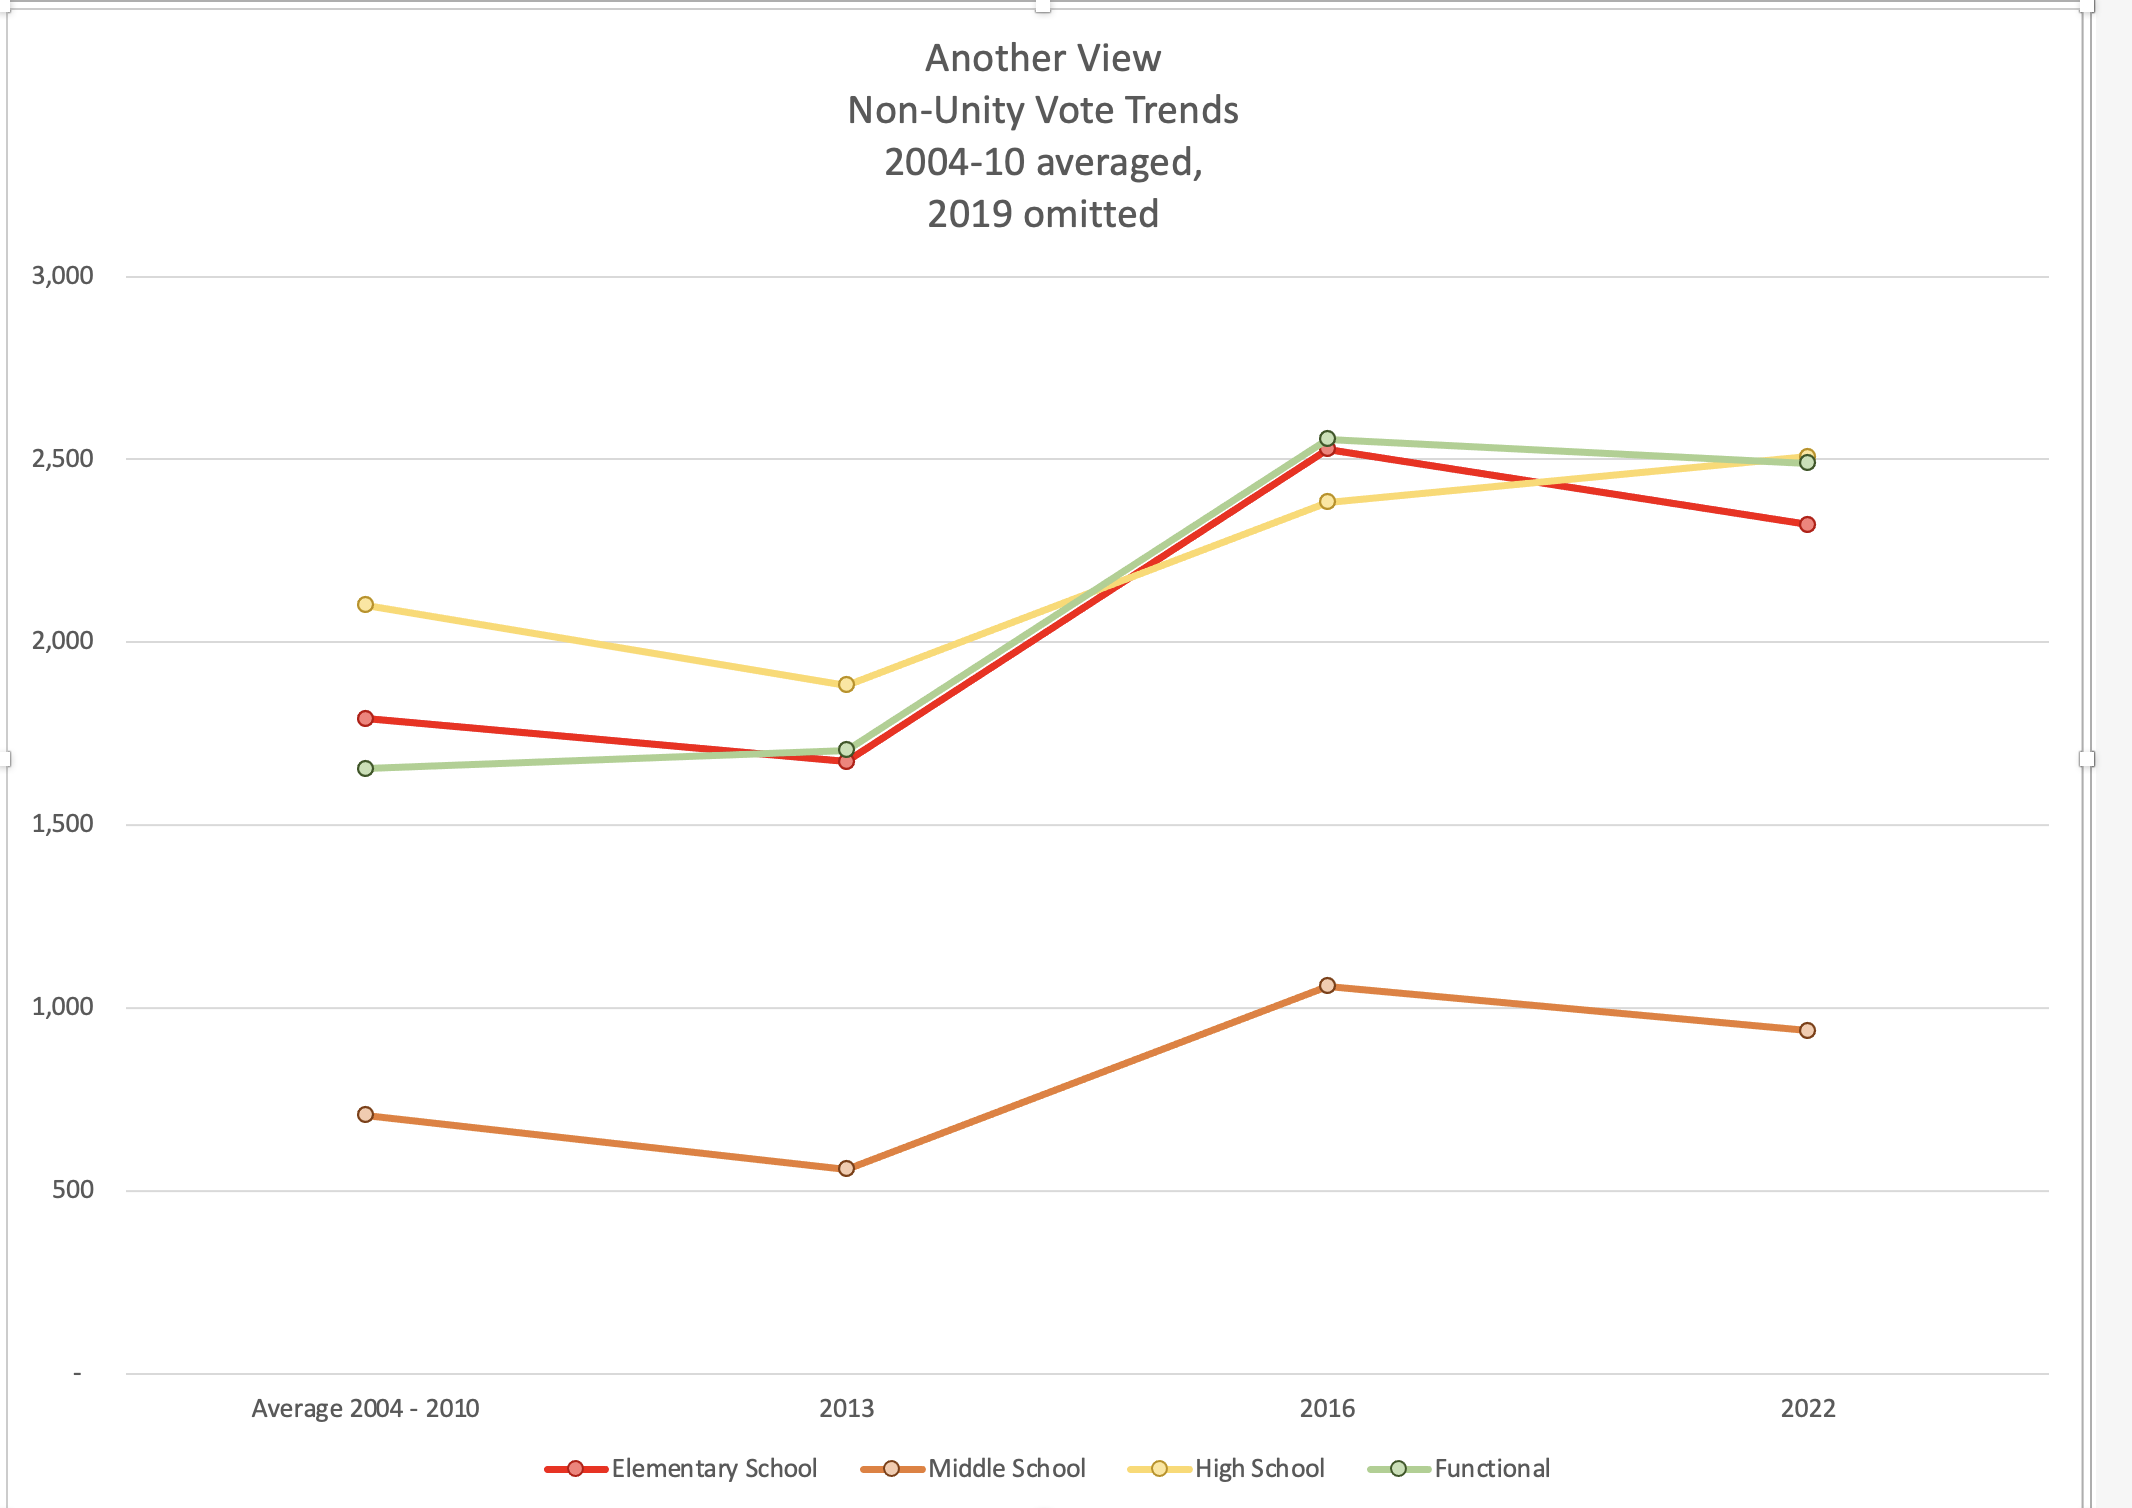
There still is an upward trend, but shallower, less clear, and with more bumps. In Elementary, for example, instead of moving from 19% to 33% (almost doubling) and only rising, we now see motion only from 1800 to 2300, with ups and downs.
Looking at votes instead of per cents does not erase all of the sense of progress, but it scales it way, way back. We cannot use this to project when the opposition will pass Unity – there’s no such clear trend. In fact, we should note that non-Unity votes fell among in-service members from 2016 to 2022.
Among all voters
It’s fine to look at the raw number of votes, as we just did. That probably gives the best picture. But a third look might be to consider what percent of members actually voted for the opposition.
For context, I reported elsewhere that of every 34 teachers, 3 voted against Unity, 4 voted for Unity, and the other 27 did not vote. Ignore Unity for the moment – what are those historic numbers for voting non-Unity?
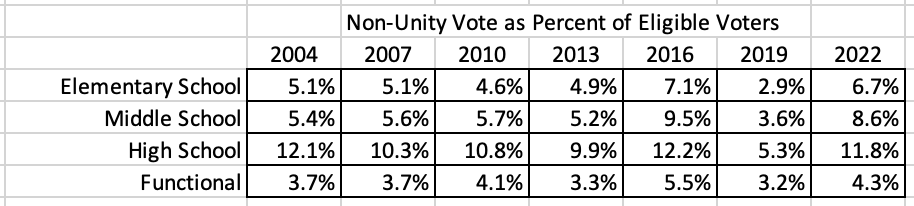
I should pause to note, these are slate votes only, actual votes are a bit higher. Good rule of thumb for a high estimate – add 10%. For example, middle school in 2013 says 5.2%. Add 0.5 to that and use 5.7% as your estimate. Elementary in 2016 says 7.1% – add 0.7 to that and work with 7.8% as your high estimate.
I can combine these numbers into one in-service number – we can see the Unity numbers, but it still does not look good:
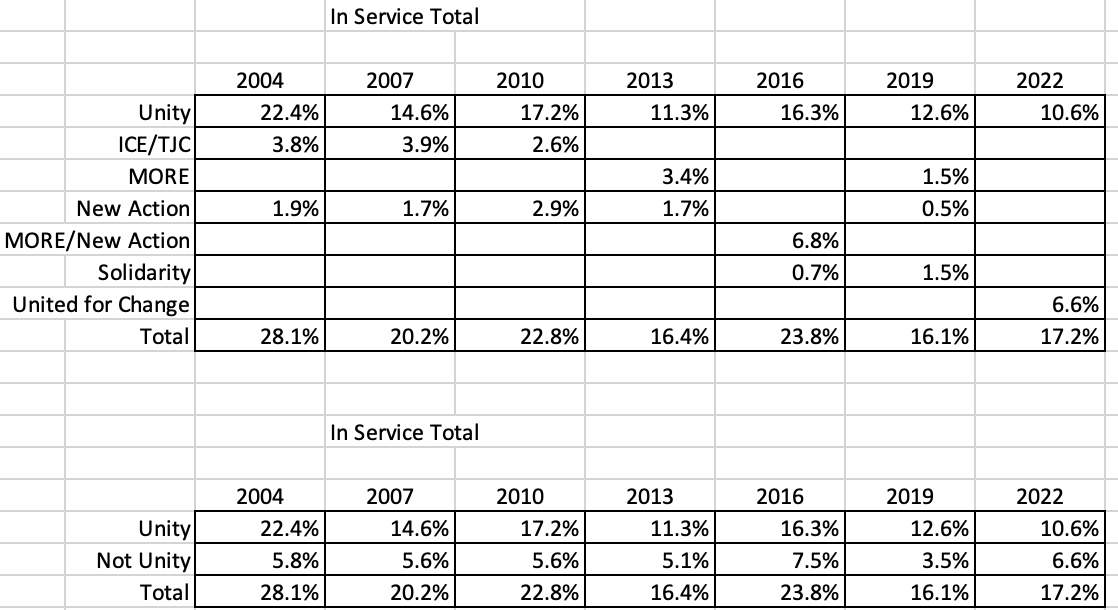
This is bad for partisans of “the opposition.” But, quite obviously, it’s far worse for Unity. They may have breathed a sigh of relief over not losing more seats, but that’s the present. No relief for them as they look into the future.
Here’s the first table, now in graph form:
In 20 years, where’s the gain?
Even blending 2004-10 and omitting 2019, not a bright picture…
The only change that comes close to significance is in middle schools. That one requires more work/research.
And what next?
The next post in this series will be a look at what is happening to Unity’s vote. You think this was a downbeat post? it’s nothing compared to what’s happening to them.
After that? A deep look into what happened with the retiree vote – which is a very different discussion.


Trackbacks