UFT Elections: Voting For Unity?
Unity won 66% of the total vote, just shy of two-thirds, and 58% among teachers. Those are, for Unity, not good numbers, maybe horrible numbers – the lowest since I’ve been paying attention, probably the lowest since the first decade of the UFT, and maybe the lowest in the history of the UFT. But Unity also breathed a sigh of relief – sure they lost the high schools, but they have lost the high schools many times before – and they avoided losing anywhere else.
Yesterday I looked at: Voting Against Unity?
What happens if we dig deeper into Unity’s numbers? What picture do we get? Weak performance, but they survived? Or something worse?
See also:
The 2022 United Federation of Teachers election needs a closer look.
Let’s start with the percentages (which is where the superficial analysis, above, comes from), then move on to the actual VOTES that Unity retained. Finally we will consider Unity voters as a segment of all eligible voters. I will use historical data from the last seven elections, going back to 2004. And for today I will only be looking at the four in-service divisions. The retiree vote requires a separate post.
In-service percents
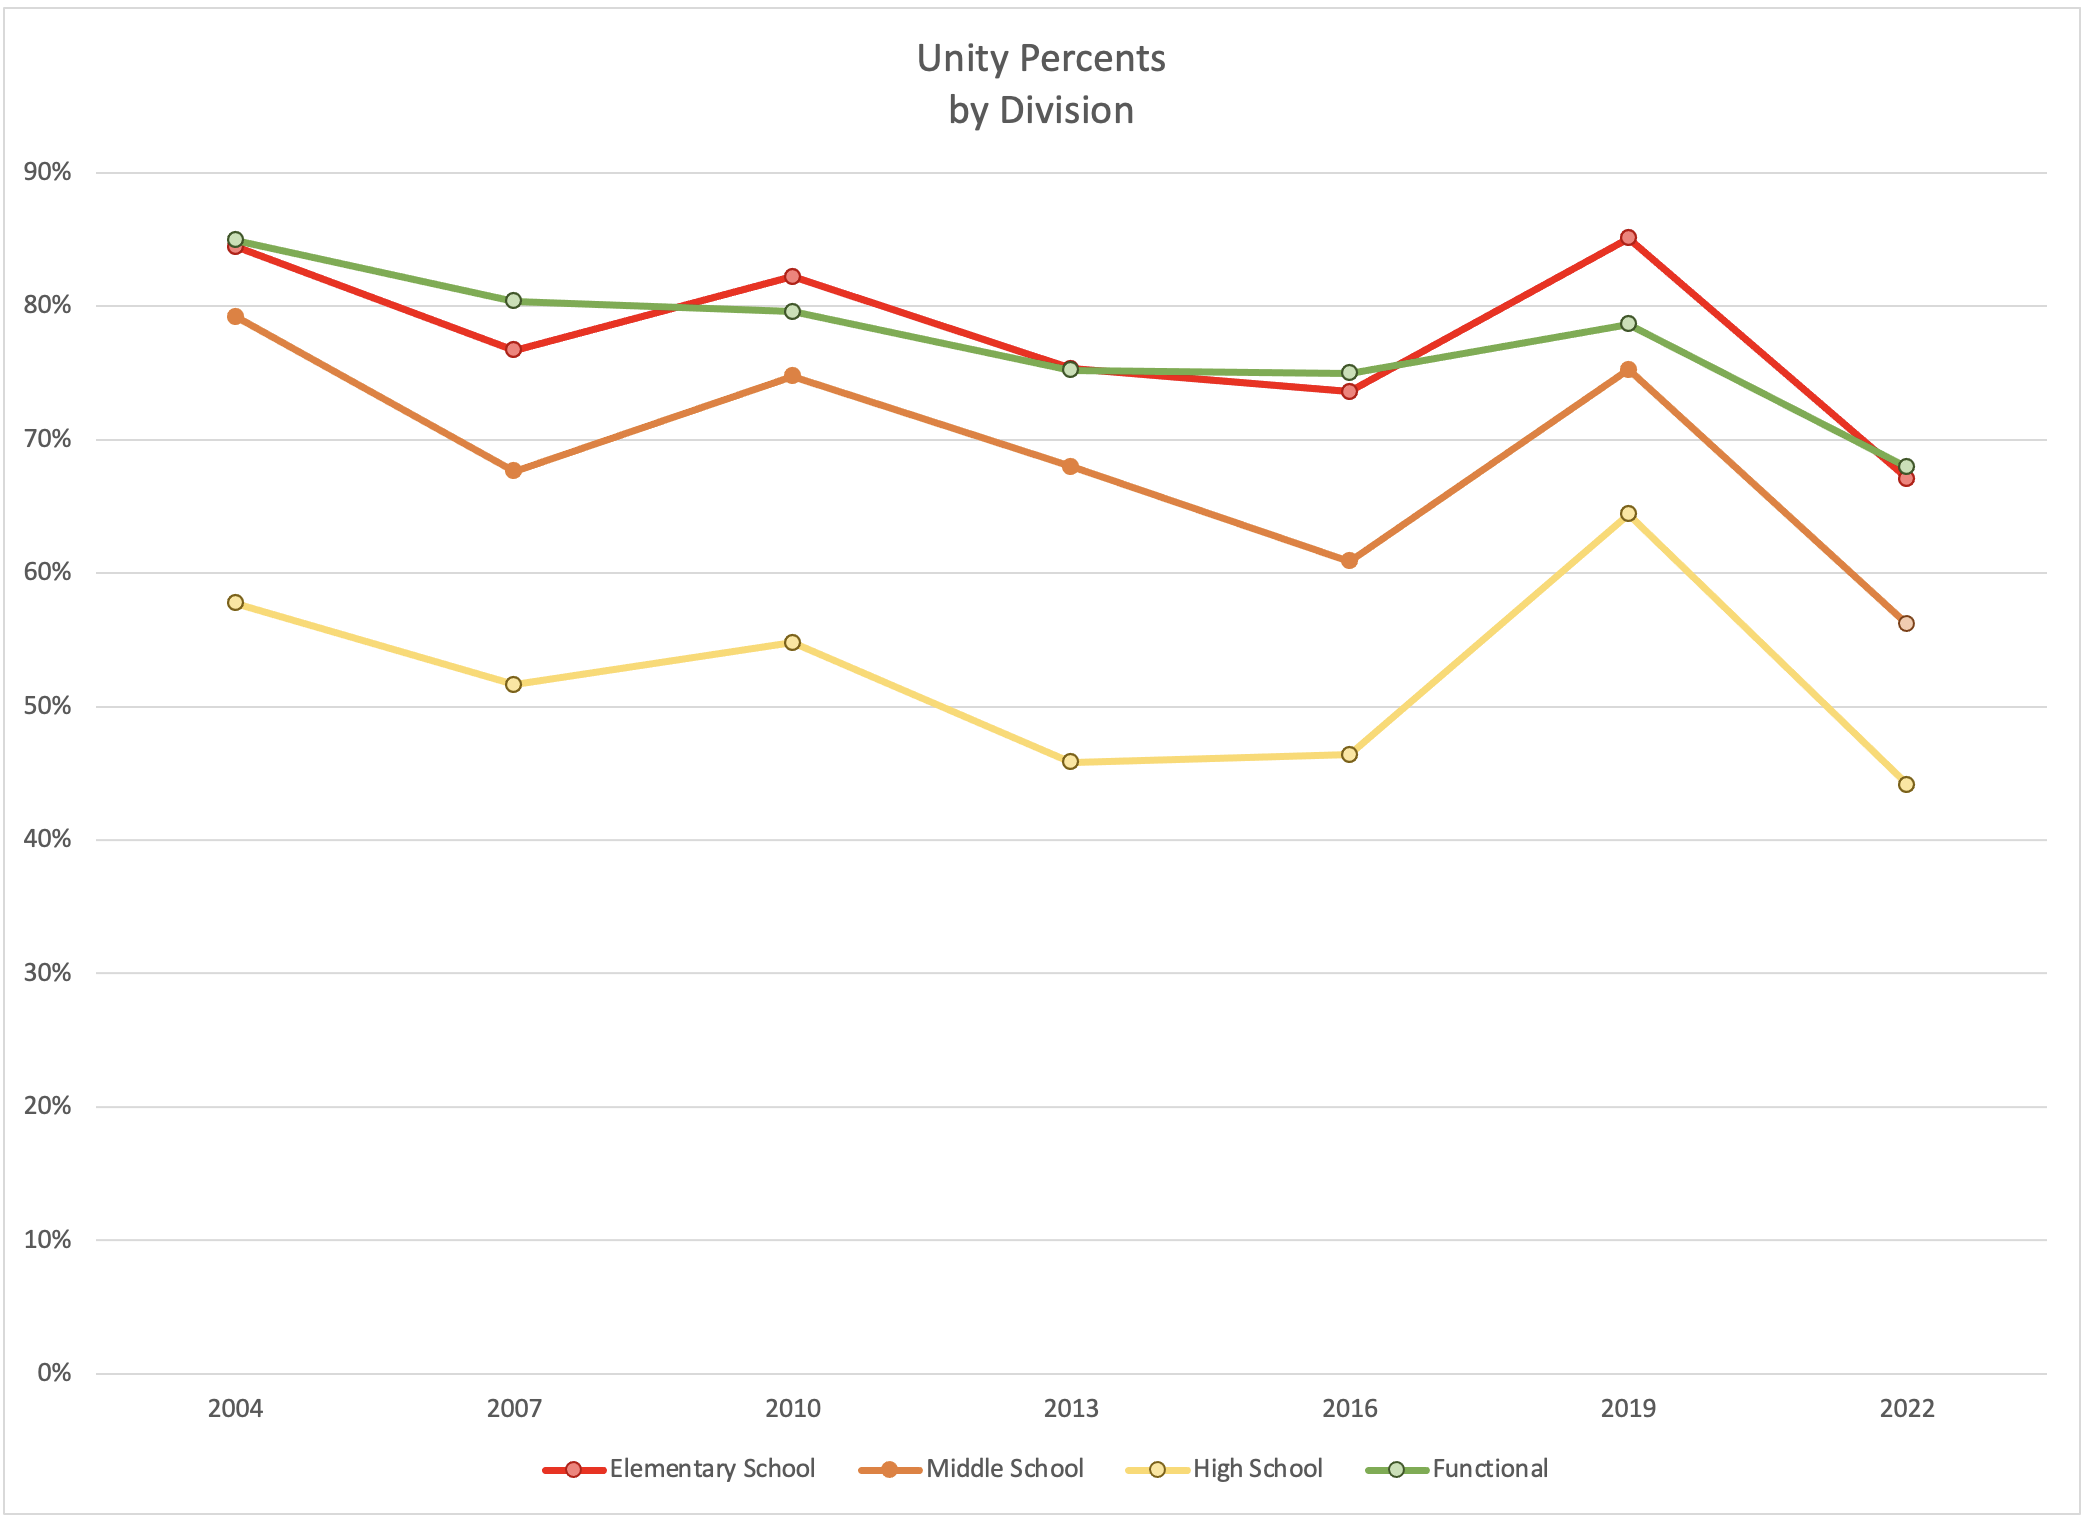
And a general pattern does emerge:
- Generally down
- a small jump in 2019, but completely reversed in 2022
- 2022 is the lowest, in every division, for the past seven election cycles
Is it possible to create trend lines from this data? Sure.

I just don’t think this is very meaningful. The end of those trend lines, by the way, are around 2040.
Could we omit 2019 to smooth the lines? Sure, but now we are forcing data to fit the story we want it to tell. This is even less meaningful, though slightly entertaining.


Those trendlines end in 2040 – but this is now pure fantasy. These graphs are for amusement, not for serious analysis.
For serious analysis, let’s leave out the percents, and look at actual vote totals.
In-service votes
I will demonstrate later this week that Unity and “not Unity” mostly activate or fail to activate our own votes. We generally do not trade votes back and forth (though it is quite heartening/disappointing to learn of someone who has changed sides).
(There was a significant exception in 2022 – a number of former Unity voters among the retirees did switch – but this was due to specific circumstances: the colossal Unity miscalculation around Medicare Advantage.)
This means that it makes sense to look at Unity vote totals. And these totals are more meaningful, by a lot, than looking at the percents (what we did in the section above).
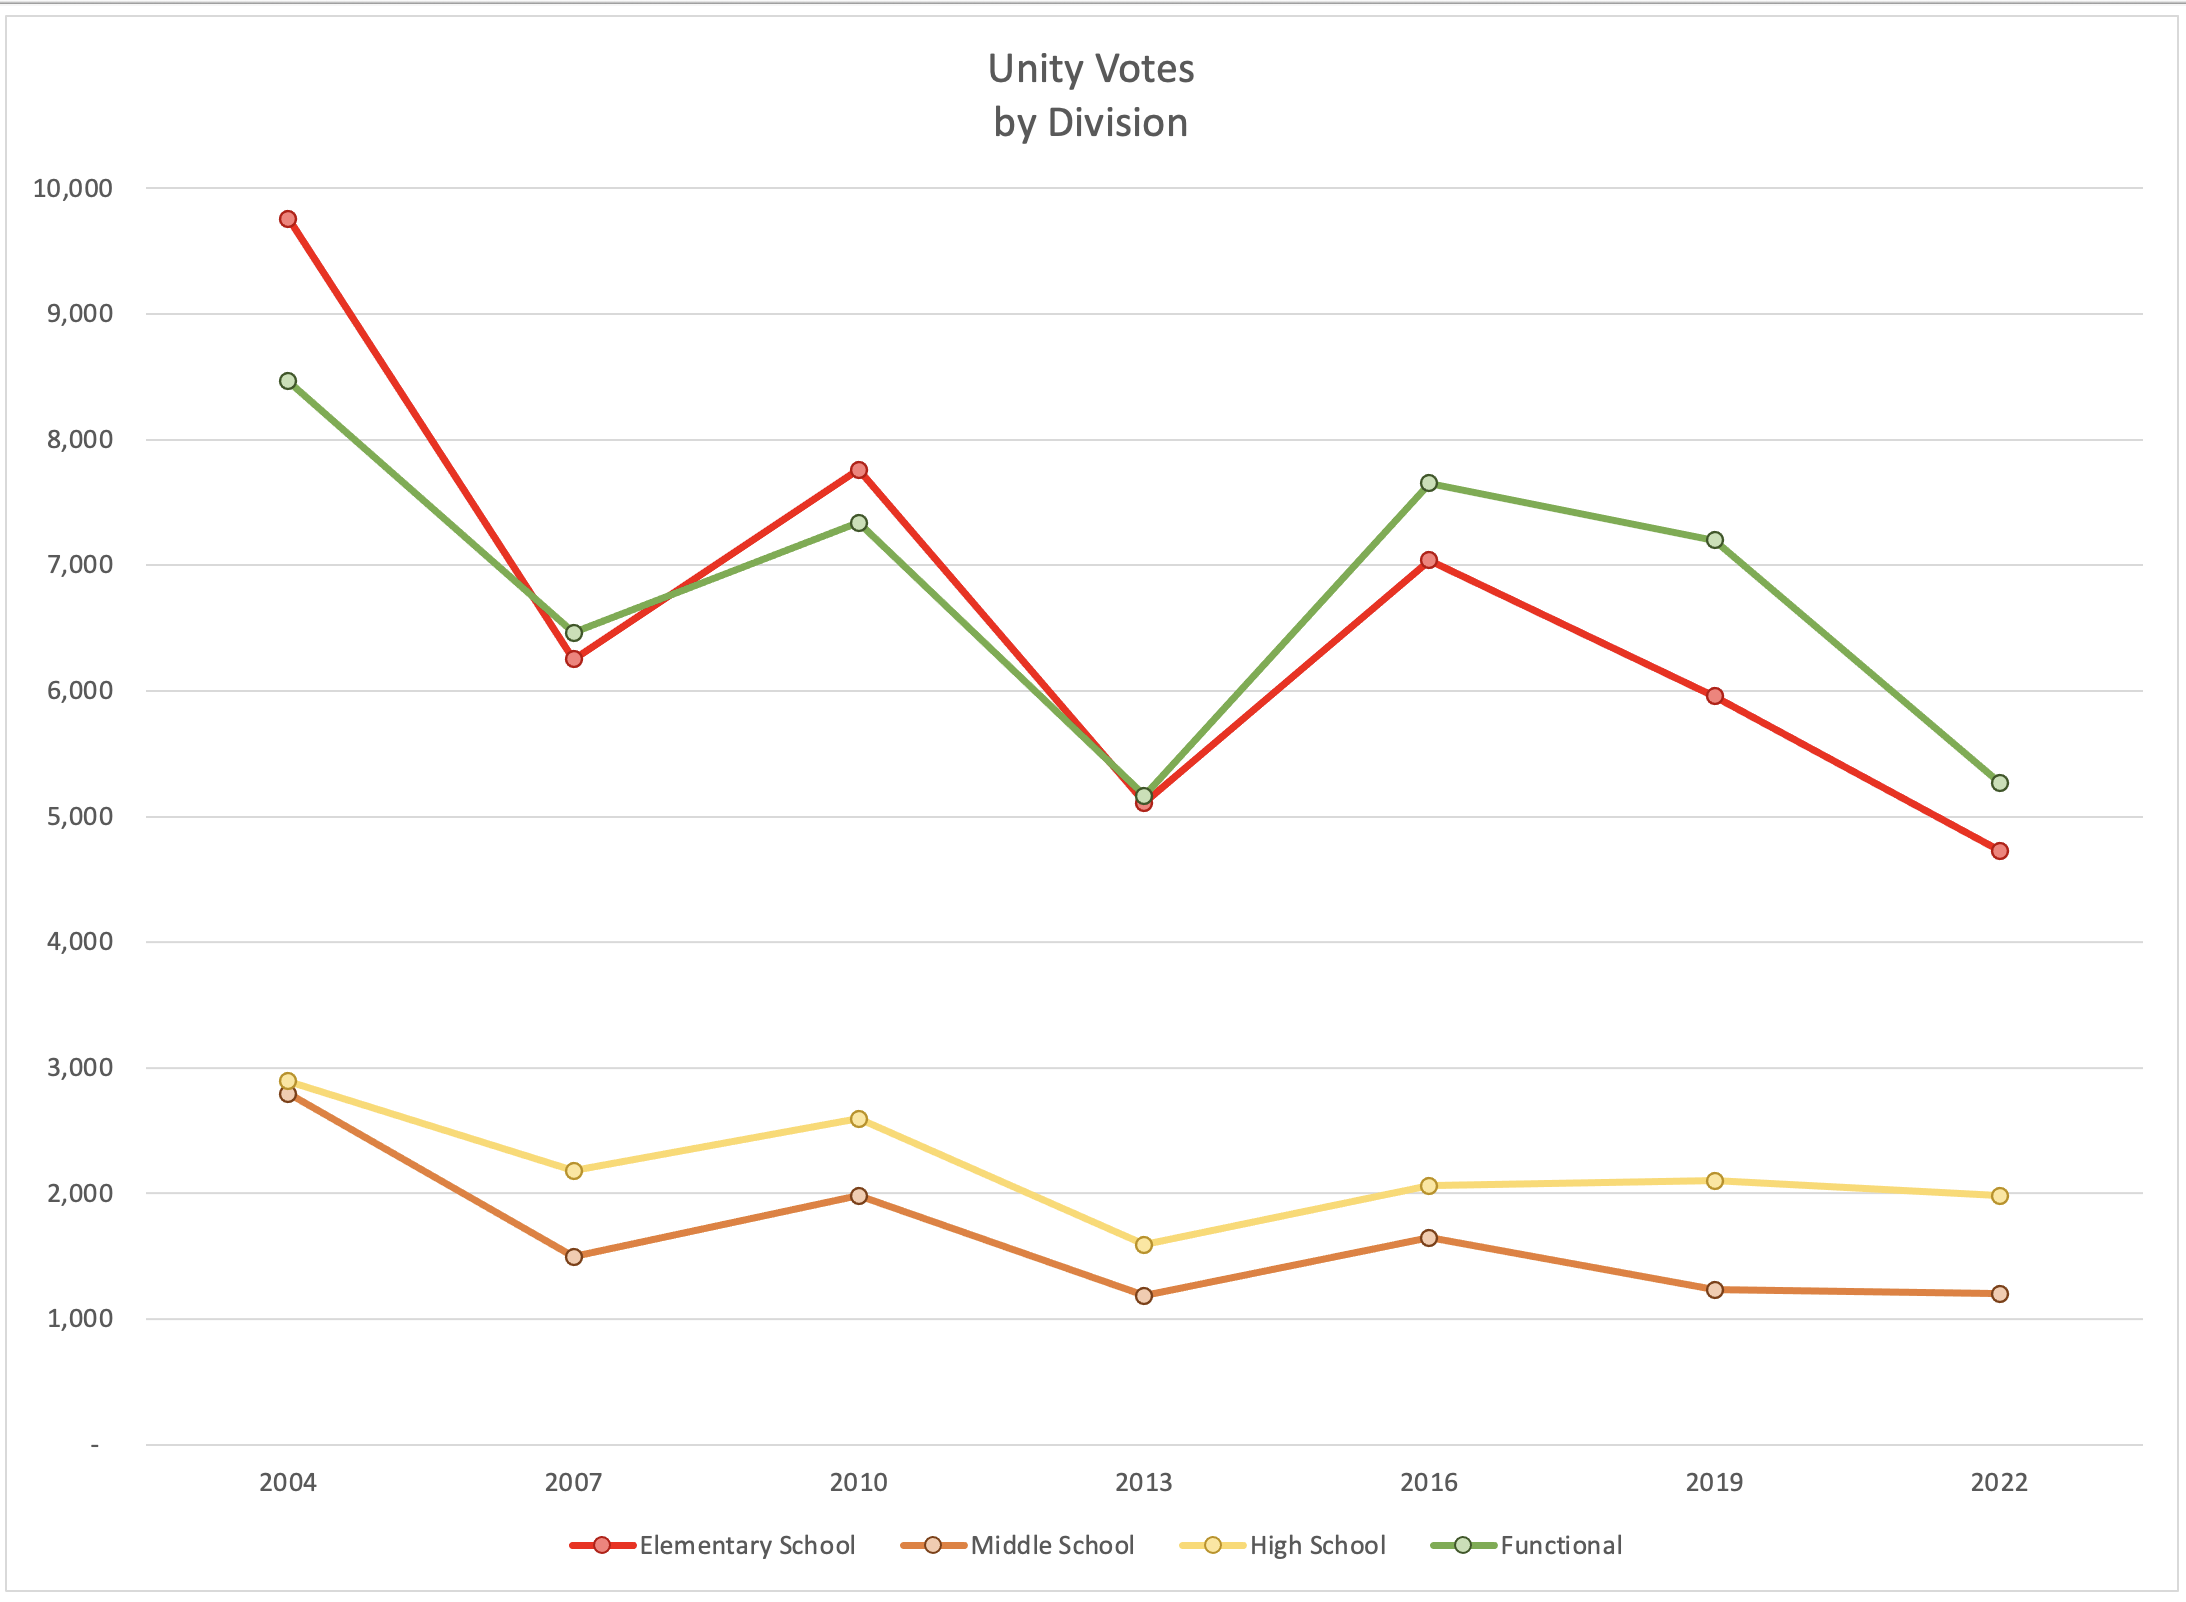
In the lower two lines, Middle and High School, they seem to have hit bottom in 2013, and more or less stayed there. But in Elementary School and among Functional, Unity continues to bleed votes.
Of particular interest is Unity’s steady decline among Elementary School teachers. This election they seem to have received their fewest votes, ever, in that division. The decline in two decades is 50%. I expected the pandemic to make all of Unity’s lines drop from 2019, but the two lower lines barely slipped, and Elementary and Functional were more dramatic than I expected.
Is this due to the DoE, seemingly with Mulgrew’s acquiescence, sending Elementary staff back sooner than the older grades – with instructional lunch and no vaccines? Is this a product of what seemed to be scary-inadequate protections for staff in D75? Or is this part of Unity’s long term loss of their core voting blocs?
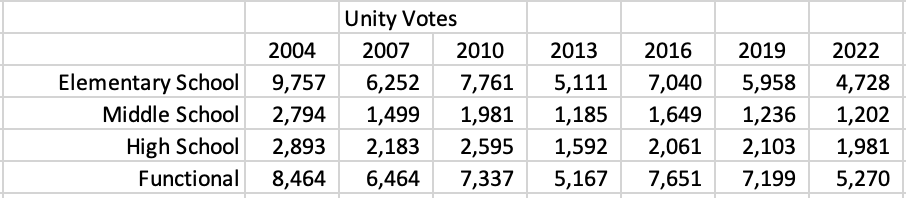
Here’s the same data, in table form.
And here it is, expressed as percentage of Unity’s 2004 vote totals:
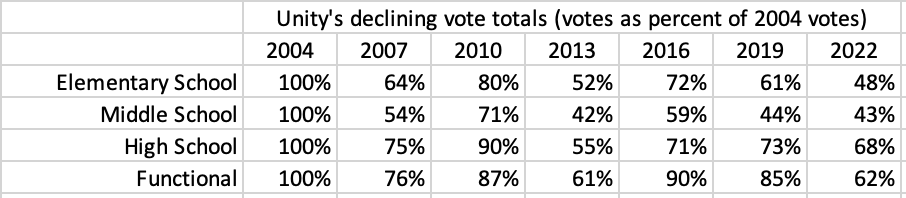
Go back to the graph. Look at what is happening. Look at the table. Look at those declines. And notice, the biggest declines are not necessarily when there are big votes for other caucuses. Unity is ailing, just fine, without any help.
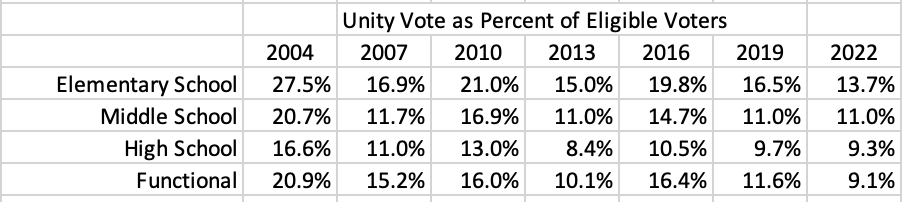
Among all voters
A third look might be to consider what percent of members actually voted for Unity. We know participation (turnout) is generally lousy, and getting worse. What portion of our members actually vote for the leadership? When they claim a mandate, how deep is that mandate?

This is devastating. Unity’s longterm loss of support is consistent across the divisions. It has been around 50% over the last seven election cycles. There is no sign of any pause. And unlike 2016, when in the face of a unified MORE/New Action slate Unity actually managed to stall their decline, there is no such sign in 2022.
(Side note: the middle school numbers here are more consistent with the other divisions than in the previous section, because a significant number of middle schools have been replaced with K-8, which vote elementary, and 6-12, which vote high school. When looking at total votes, that makes it look like Unity is suffering bigger losses among middle school. When looking at votes cast divided by votes mailed, it balances out.)
Here are the numbers in a table:
(note, these are slate numbers only. Once split ballots are added in, the totals go up, but just a bit.)
In my previous post I laid out a pretty clear case that United for Change did not have any big breakthrough among in-service members. But that seems to have had no impact on Unity – they continued their longterm decline.
That they managed to not lose more seats was unfortunate (or fortunate, for them). But that does not change the outlook – they are not doing well, and they have not been, not for a long time.
And what next?
I have been looking at vote totals, Unity and non-Unity, isolated from each other. I will lay out data that explains why this makes sense.
Something just happened among the retirees, very different from what is happening in the in-service divisions.
And then there will have to be some more digging into what is causing these changes, especially the longterm changes. There is a lot here, and that will take some time.
Finally, there needs to be a guide. Lessons learned. What steps to take next. But that part I will share privately.


Trackbacks