Even the incomplete results are incomplete
I wasn’t there to complain.
Missing Easy Numbers
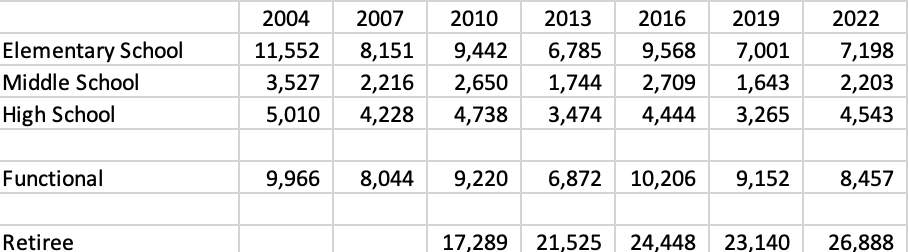
This morning I was teaching. UFT Election chair Carl Cambria shared the number of votes per division (they are in the table, below), and Dave Hickey said that 198,900 ballots were mailed. Every other election he’s included how many were mailed in each division, which is helpful to understanding the other numbers we are seeing. But not this time.
When I arrived (almost 4) that breakdown was still not available. And I was not able to get it. “Tomorrow.” Nuisance.
Late Votes Counted
The deadline was receipt at AAA 8 AM Monday. A Monday is bad, and what is this 8AM nonsense? They decided (I assume the election committee?) to include ballots received Monday and Tuesday. Which is fantastic. About 1600 more votes.
(we should have probably checked to make sure these ballots were not from Arizona, right?)
Subtraction by Addition
But now we have less information, because all of the vote counts shared by division are now wrong. The total vote is up 1600, but we do not know what division those votes fall in.
A Surprising Nugget
Dave Hickey shared that he saw a pile of about 200 retiree ballots that were not slate (voted for individuals, not caucuses). That makes 99% slate voting. In the previous election retirees voted slate 95% of the time. We verified that this was approximately correct. That is a very big change. Was this election a referendum on Medicare? Turnout was up, although we wanted more, and there was quite a swing to UfC, though we wanted more, so yes, maybe yes. I’m a bit surprised. I expected more Unity voters to check off 11 officers, and omit Mulgrew. Maybe they either stuck, or switched completely.
Neither a Shocking Upset, nor a Resounding Vote of Confidence
I laid out two results in the last two days, both extreme. Neither the amazing United for Change upset nor that romp that would stop Unity from reexamining course happened.
A Table and A Chart, both bad
Since I don’t know where the extra 1600 votes belong, both the table and the chart are wrong. But close. I’ll do better graphics and numbers when they are available.
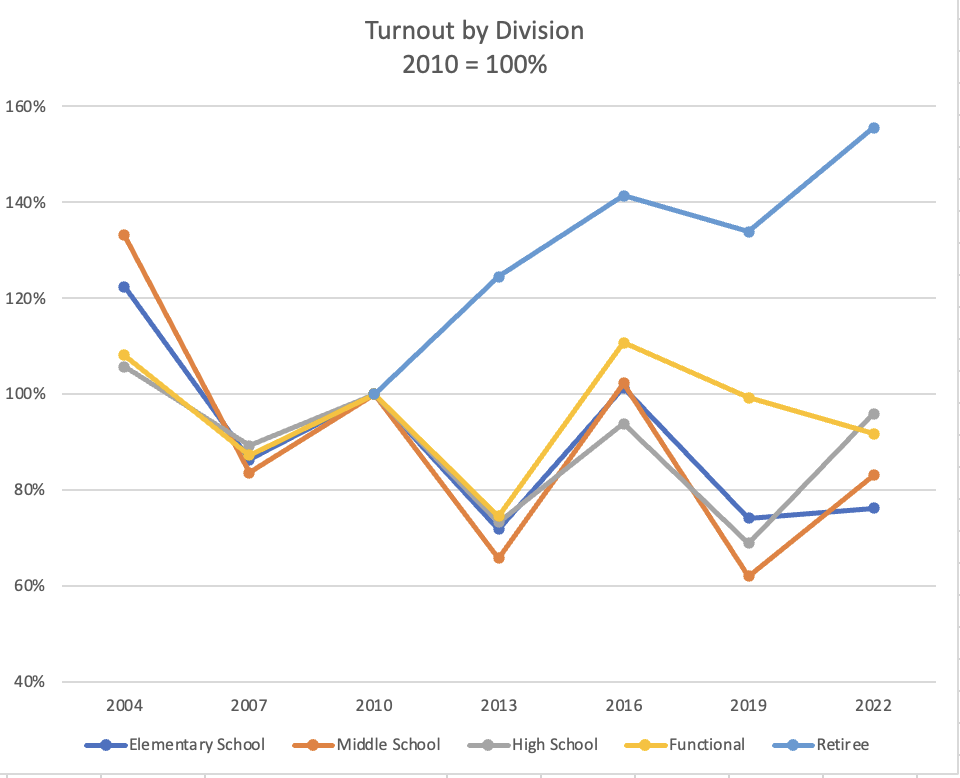
For now, the chart is just raw turnout by division, by year. I am missing two years of retiree data – what I had was just the cap number for those years.
The graph treats 2010 as 100% for each division, and you can see patterns. 2022 (still missing numbers) seems to roughly return to 2016 levels, after a dip in 2019. Wonder what happened to elementary? And the retirees are their own story (Medicare Advantage).


Thank you for this. It looks like the retiree vote will be weighted down, correct?
Since the retiree vote will be between 26,888 and 28,488, and the retiree vote will count as 23,500, each retiree’s vote will count as between 0.825 and 0.875 of a vote. So about a 15% “discount,” if you will.