Changing Membership, Changing Electorate
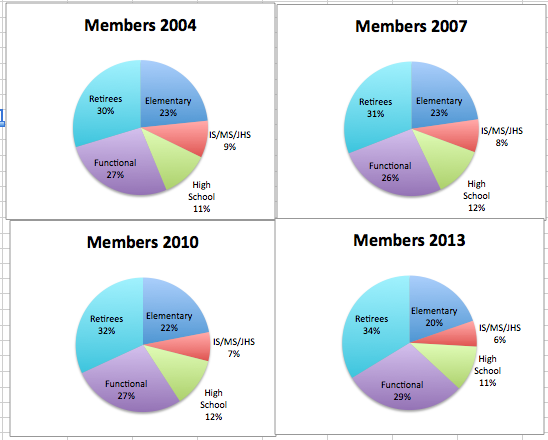
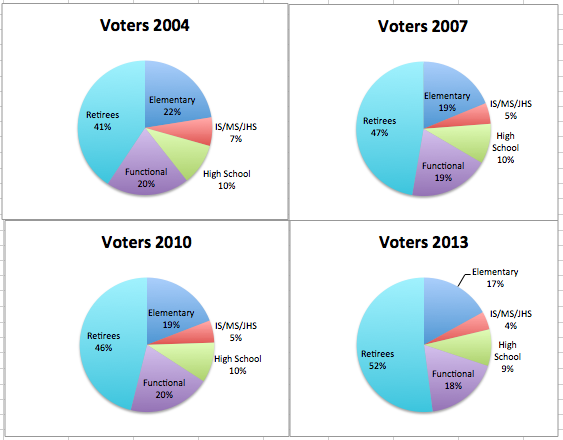
This is a time series of charts, showing UFT membership and votes by division for the 2004, 2007, 2010, and 2013 elections. I created the charts from the numbers of ballots mailed and the number of ballots returned, which has been part of the reported election results, including this year.
Raw numbers, by division, by year, with turnout percentages are included at the bottom of this post.
Members by Division, by year
Voters by Division, by Year
It is also worth noting that the areas represent different numbers of members, and of voters.
Members
2004 – 154 thousand
2007 – 164 thousand
2010 – 170 thousand
2013 – 176 thousand
Voters
2004 – 56 thousand
2007 – 49 thousand
2010 – 56 thousand
2013 – 45 thousand
The jump in the percentage of votes cast by retirees is a direct result of the constitutional amendments raising the cap on how much retiree votes count. New Action strongly opposed those amendments. Retirees cast 53% of the votes, an absolute majority, in this election.
The special decline in middle school votes may be due to how teachers in in K-8 or 6-12 schools are categorized. I do not know if this is the correct explanation.
In the course of a decade, the number (not percent) of teachers voting has fallen from 21 thousand to under 13 thousand, and whereas teachers cast just under 40% of the vote nine years ago, they cast exactly 30% today.
| Division | Year | |||
| Mailed | Returned | % voting | ||
| ELEM | 2004 | 35,511 | 12,170 | 34% |
| 2007 | 36,912 | 8,904 | 24% | |
| 2010 | 36,907 | 10,286 | 28% | |
| 2013 | 34,163 | 7,311 | 21% | |
| IS/JHS | 2004 | 13,489 | 3,720 | 28% |
| 2007 | 12,841 | 2,384 | 19% | |
| 2010 | 11,697 | 2,880 | 25% | |
| 2013 | 10,807 | 1,875 | 17% | |
| HS | 2004 | 17,455 | 5,399 | 31% |
| 2007 | 19,799 | 4,568 | 23% | |
| 2010 | 19,931 | 5,197 | 26% | |
| 2013 | 19,040 | 3,800 | 20% | |
| Teachers | 2004 | 66,455 | 21,289 | 32% |
| Subtotal | 2007 | 69,552 | 15,856 | 23% |
| 2010 | 68,535 | 18,363 | 27% | |
| 2013 | 64,010 | 12,986 | 20% | |
| FUNCTIONAL | 2004 | 40,424 | 10,829 | 27% |
| 2007 | 42,614 | 9,133 | 21% | |
| 2010 | 45,889 | 10,622 | 23% | |
| 2013 | 51,040 | 7,698 | 15% | |
| Inservice | 2004 | 106,879 | 32,118 | 30% |
| Subtotal | 2007 | 112,166 | 24,989 | 22% |
| 2010 | 114,424 | 28,985 | 25% | |
| 2013 | 115,050 | 20,684 | 18% | |
| RETIRED | 2004 | 45,082 | 21,998 | 49% |
| 2007 | 50,208 | 22,427 | 45% | |
| 2010 | 53,560 | 24,795 | 46% | |
| 2013 | 58,537 | 22,462 | 38% | |
| TOTAL | 2004 | 151,961 | 54,116 | 36% |
| 2007 | 162,374 | 47,416 | 29% | |
| 2010 | 167,984 | 53,780 | 32% | |
| 2013 | 173,587 | 43,146 | 25% |
See turnout analysis here.


It makes the UFT election a farce when retirees are the majority of the votes.
Certainly apathy is our enemy. Did you read this yet: https://jd2718.org/2013/04/28/uft-election-turnout-is-concerning/ ?
Good turnout is not my goal, but it would be a side-effect of getting many more of our new teachers involved in the life of their chapters. Unfortunately, that is not our priority. And it should be.