What Happened to Hochul’s Vote?
Did Kathy Hochul do much worse than Andrew Cuomo? How did that happen? Can I make maps that will help us understand? Sure I can!
Some historic data first:
| Dem | Rep | Ind | Grn | Other | |
| 1998 | Vallone | Pataki | Golisano | Lewis | Mccaughey (Liberal) |
| 1998 | 1.57M | 2.57M | 0.36M | 0.1M | 0.1M |
| 1998 | 33.2% | 54.3% | 7.7% | 1.1% | 1.7% |
| 2002 | McCall | Pataki | Golisano | ||
| 2002 | 1.53M | 2.26M | 0.65M | ||
| 2002 | 33.5% | 49.4% | 14.3% | ||
| 2006 | Spitzer | Faso | |||
| 2006 | 3.09M | 1.27M | |||
| 2006 | 65.3% | 27.1% | |||
| 2010 | Cuomo | Paladino | Hawkins | ||
| 2010 | 2.91M | 1.55M | 0.1M | ||
| 2010 | 63.0% | 33.5% | 1.3% | ||
| 2014 | Cuomo | Astorino | Hawkins | ||
| 2014 | 2.07M | 1.54M | 0.2M | ||
| 2014 | 54.3% | 40.3% | 4.8% | ||
| 2018 | Cuomo | Molinaro | Hawkins | Sharpe (Libertarian) | |
| 2018 | 3.64M | 2.21M | 0.1M | 0.1M | |
| 2018 | 59.6% | 36.2% | 1.7% | 1.6% | |
| 2022 | Hochul | Zeldin | |||
| 2022 | 3.03M | 2.73M | |||
| 2022 | 52.6% | 47.4% |
I included any parties that both broke 1% and got at least 50k votes. I listed candidates under the main party they campaigned under – sorry WFP. In 1998 the Right to Life (which seems not to have actually had one) got 1.2%.
Now, there’s not enough here to figure out what happened. Hochul scored a lower percent than Cuomo scored in three races, but not much less than 2014. Her vote total exceeded his from 2014 and 2010. And, remember, 2018 everyone was petrified of Trump, which drove urban turnout. Also, no one has a percent as high as Eliot Spitzer, and that was before Trump.
First item. Turnout looks lower in 2022 than 2018.
Turnout 2022 compared to 2018

And this is a VERY specific map. Turnout was mixed in NY from Syracuse, west. Turnout was up slightly in the North Country, flat in the Hudson Valley, up slightly on Long Island, and down, kind of dramatically, in the four major boroughs and Westchester. The biggest fall? The Bronx, where turnout dropped 33.4%
Was this drop in voters felt equally by both parties? Let’s look at Zeldin first:
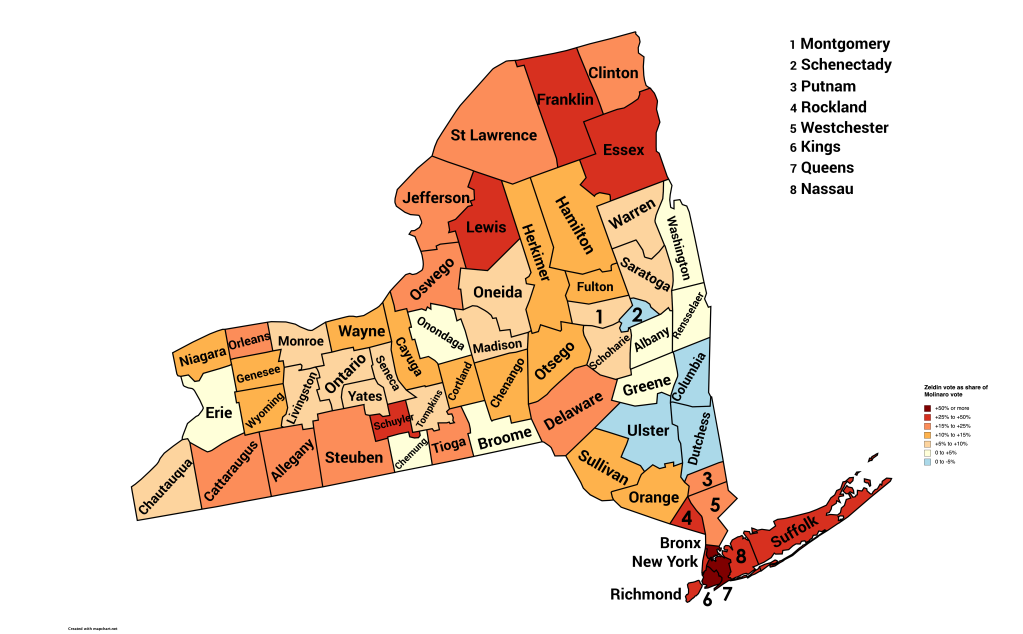
Zeldin votes as share of Molinaro votes

The legend came out tiny, sorry. But that cherry red is over a 25% increase in raw votes (not percentage) and the dark red is over 50%. Zeldin lost votes or was flat along the CT/MA/VT border and in one county, from Dutchess to Washington, but he gained votes everywhere else in the state. And he topped Molinaro by the biggest numbers on Long Island, in Rockland, and especially in NYC, precisely where the total vote dropped the most sharply. Vote dropped? And Zeldin votes went up? Same places? That’s probably more than enthusiasm – that’s some groups shifting sides.
Let’s see where Hochul’s votes rose and fell.
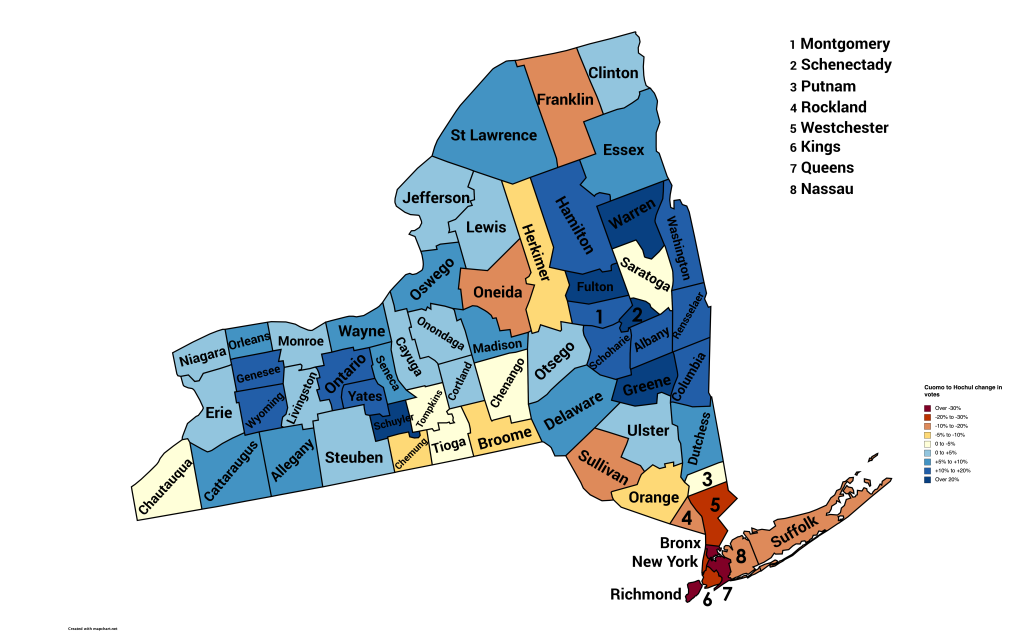
Hochul votes as Share of Cuomo 2018 votes

Surprised? Hochul generally outran Cuomo upstate, except for a bit of the Trump-y southern tier. And she creamed him in the Capitol District and upper Hudson Valley. But she ran way behind him in Rockland, Westchester, NYC, and Long Island.
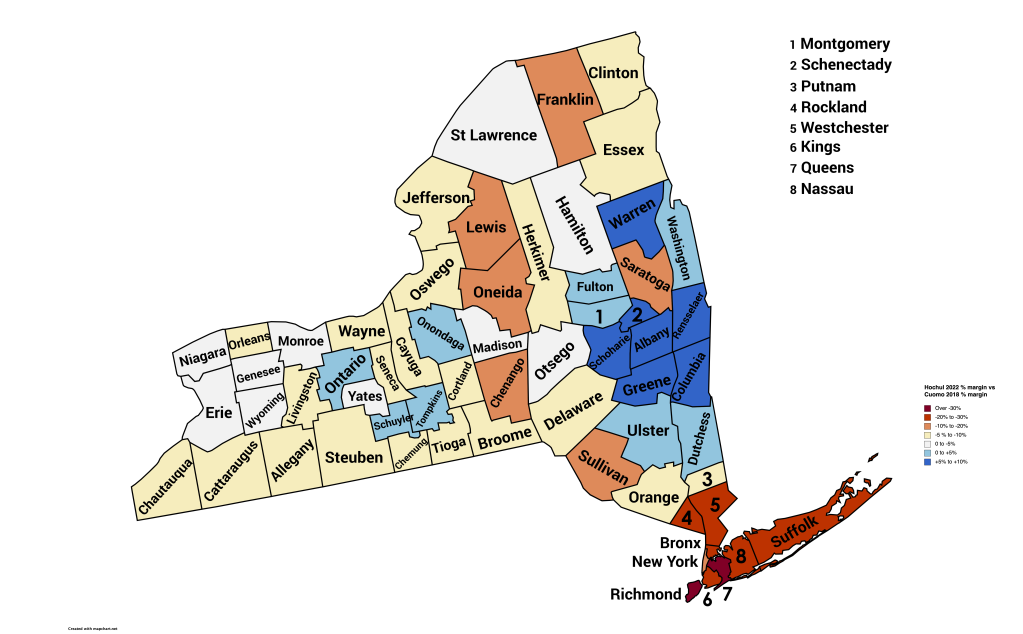
Most people would not look at difference in raw votes. They would consider the margin by which the democrat trailed or led the republican. OK, that’s a slightly different lens. If Cuomo lost Dutchess county by 7%, and Hochul lost by 4%, we can call that a plus three (+3%) swing to Hochul. Here’s what that looks like on a map:
Margin swing Cuomo 2018 to Hochul 2022

Nice when a map confirms what we expected! Hochul ran nearly even with Cuomo 2018 in most of the state, outpaced him in the Capitol District (the area around Albany) and the upper Hudson Valley, and did far worse in Rockland, Westchester, NYC, and Long Island.
I was talking to someone from the WFP today, and he said “Jon. but 2018 was amazing turnout in NYC, everyone was wild about Trump.” So, having already downloaded 2014 data, I answered “OK, I’ll compare Hochul to 2014, figure that’s more of a baseline.” And I did.
A quick peek at turnout, before we proceed. Sorry for not sticking to the green scale. I think I got distracted.
Turnout 2022 compared to 2014

It’s going to be hard to look at raw votes between 2014 and 2022, because totals for everyone are up, pretty much everywhere, except 3 fairly lightly populated North Country counties. So we will just look at percentage swing.
Margin swing Cuomo 2014 to Hochul 2022

Color scales are not identical to the 2018 to 2022 map, sorry. But you get the idea.
In the last decade some upstate areas – along the southern tier – in the North Country, have added substantial GOP votes. This needs more work, because these are definitely NOT the counties that swung hardest to the GOP in the age of Trump, though they all did swing at least a little.
But also, all of NYC except Manhattan, Long Island, and Rockland added Republican votes.
In fact, I didn’t repeat the map you can see at Politico, but Hochul and Cuomo carried the same counties upstate.
In the Capitol District and Lower Hudson Valley, Cuomo only carried Ulster and Albany. Hochul took those, and also Schenectady and Columbia.
But the biggest changes were Hochul losing Rockland, Staten Island, Nassau, and Suffolk – all which Cuomo won.
Last Notes
The Capitol District and Lower Hudson are growing more democratic, but also more progressive. It looks like the Greens had been doing better there in the NYC and the suburbs, and the Working Families Party did well in parts of the 5 boroughs, but also Tompkins (Ithaca, the colleges), and the Capitol District and Upper Hudson.
NYC needs a look at the Election District level, or at least the Assembly District level, to get a better handle on which Democratic voters didn’t vote, and which switched to Zeldin. Something like that would be useful for Rockland and Long Island as well.
Since Pataki, New York has looked so Democratic Party run that we might forget that statewide things have swung back and forth. Parts of this state, this city, may be realigning. Or it could just be a fluke election. Me? I am not voting fluke.
That’s one question to dig into. Another, a big one, the Democrats lost Congressional seats on Long Island (Nassau and Suffolk), in the Lower Hudson Valley (that’s Maloney – Westchester, Rockland, and Putnam), and District 19, which stretches from Tioga and Tompkins all the way to Greene and Columbia, so that is more of a mixed district. But for the other three, do those losses represent long-term voter shifts? or just Hochul lagging Cuomo in those areas? Not easy questions.
And yeah, in answer to my original question, Hochul did a lot worse than Cuomo’s best election, and just a little worse than his election before that.
The data comes from the NYS Board of elections, except 2022 comes from Politico, where all returns were unofficial, and mostly incomplete (95%, 98%, like that)

Hochul won because election fraud, zeldin was winning all over nearly 30-40% city. Another sham like arizona and nevada, 216-19 republicans destroyed the dems.
Trump’s not president, Zeldin’s not governor, and the Republicans do not control the senate.
You can say dumb things loudly, and repeat them, they’re still dumb.
Or you can say smart things. You can notice that Hochul ran well ahead of Cuomo upstate. You can notice that Zeldin barely improved on Molinaro upstate.
But calling every result you don’t like “a sham” is just silly.