Votes for Congress in New York State 2022
Most of us know, Democrats lost four districts in New York, including two on Long Island. New York was the worst swing for the Democrats in the country, arguably worse than the loss of four in Florida. In Florida an aggressive gerrymander worked, and the statewide GOP got good turnout – but Democrats held their own exactly where they were expected to.
In New York, it looks like Democratic vote failed to meet expectations hardly anywhere. But “anywhere” introduces the idea of “where” which means we might turn things up looking at some maps. OK.
Before you go on, you might like to take a look at what I wrote about the governor’s race yesterday. There’s a pretty good argument to be made that there were very different dynamics at play – I might use I-84 as the dividing line – from Port Jervis through Poughkeepsie to somewhere on the northwest CT border. Above and to the left, we have some regional variation, but it’s kind of a regular state. Down and to the right, the northern suburbs, NYC, and Long Island are a different sort of animal. In particular this election Hochul did far worse in the lower part (NYC etc) than Cuomo had in 2018, but she ran close to him or even better in the first part. Also, turnout plummeted in the NYC etc part for the Democrats. It rose dramatically, but not nearly as much, for the Republicans downstate.
538
I have followed 538 for a while. They can slice up data pretty well. They are not particularly good at analyzing it. They don’t have much of a sense of history (though I have seen some improvement). They don’t write very well, and as someone who doesn’t write particularly well, I claim some expertise. And their “model” or really “models” remind me of boys making a formula for picking the MVP. Then not liking the results, and adjusting the formula. And doing it again and again until it gives the result they expected. So their prior expectations litter the result, but those expectations are not completely wrong, and in the process of tinkering they might begin to recognize some interesting stuff. That’s pretty much my understanding of Nate Silver, except he has a lot more time, really powerful computers, paid staff, and chronological age over 11.
All of which is to say I am using 538s Deluxe Model, because it is the one Silver has tinkered with the most. Here’s what it predicted for New York State (map looks red because of western NY, the Southern Tier, Central New York, the North Country, and the Capitol Region – which are all less dense than the concentration of districts in the Lower Hudson Valley, New York City (11 districts) and Long Island (4 districts).
538 Deluxe Forecast: Margins in NY Congressional Districts
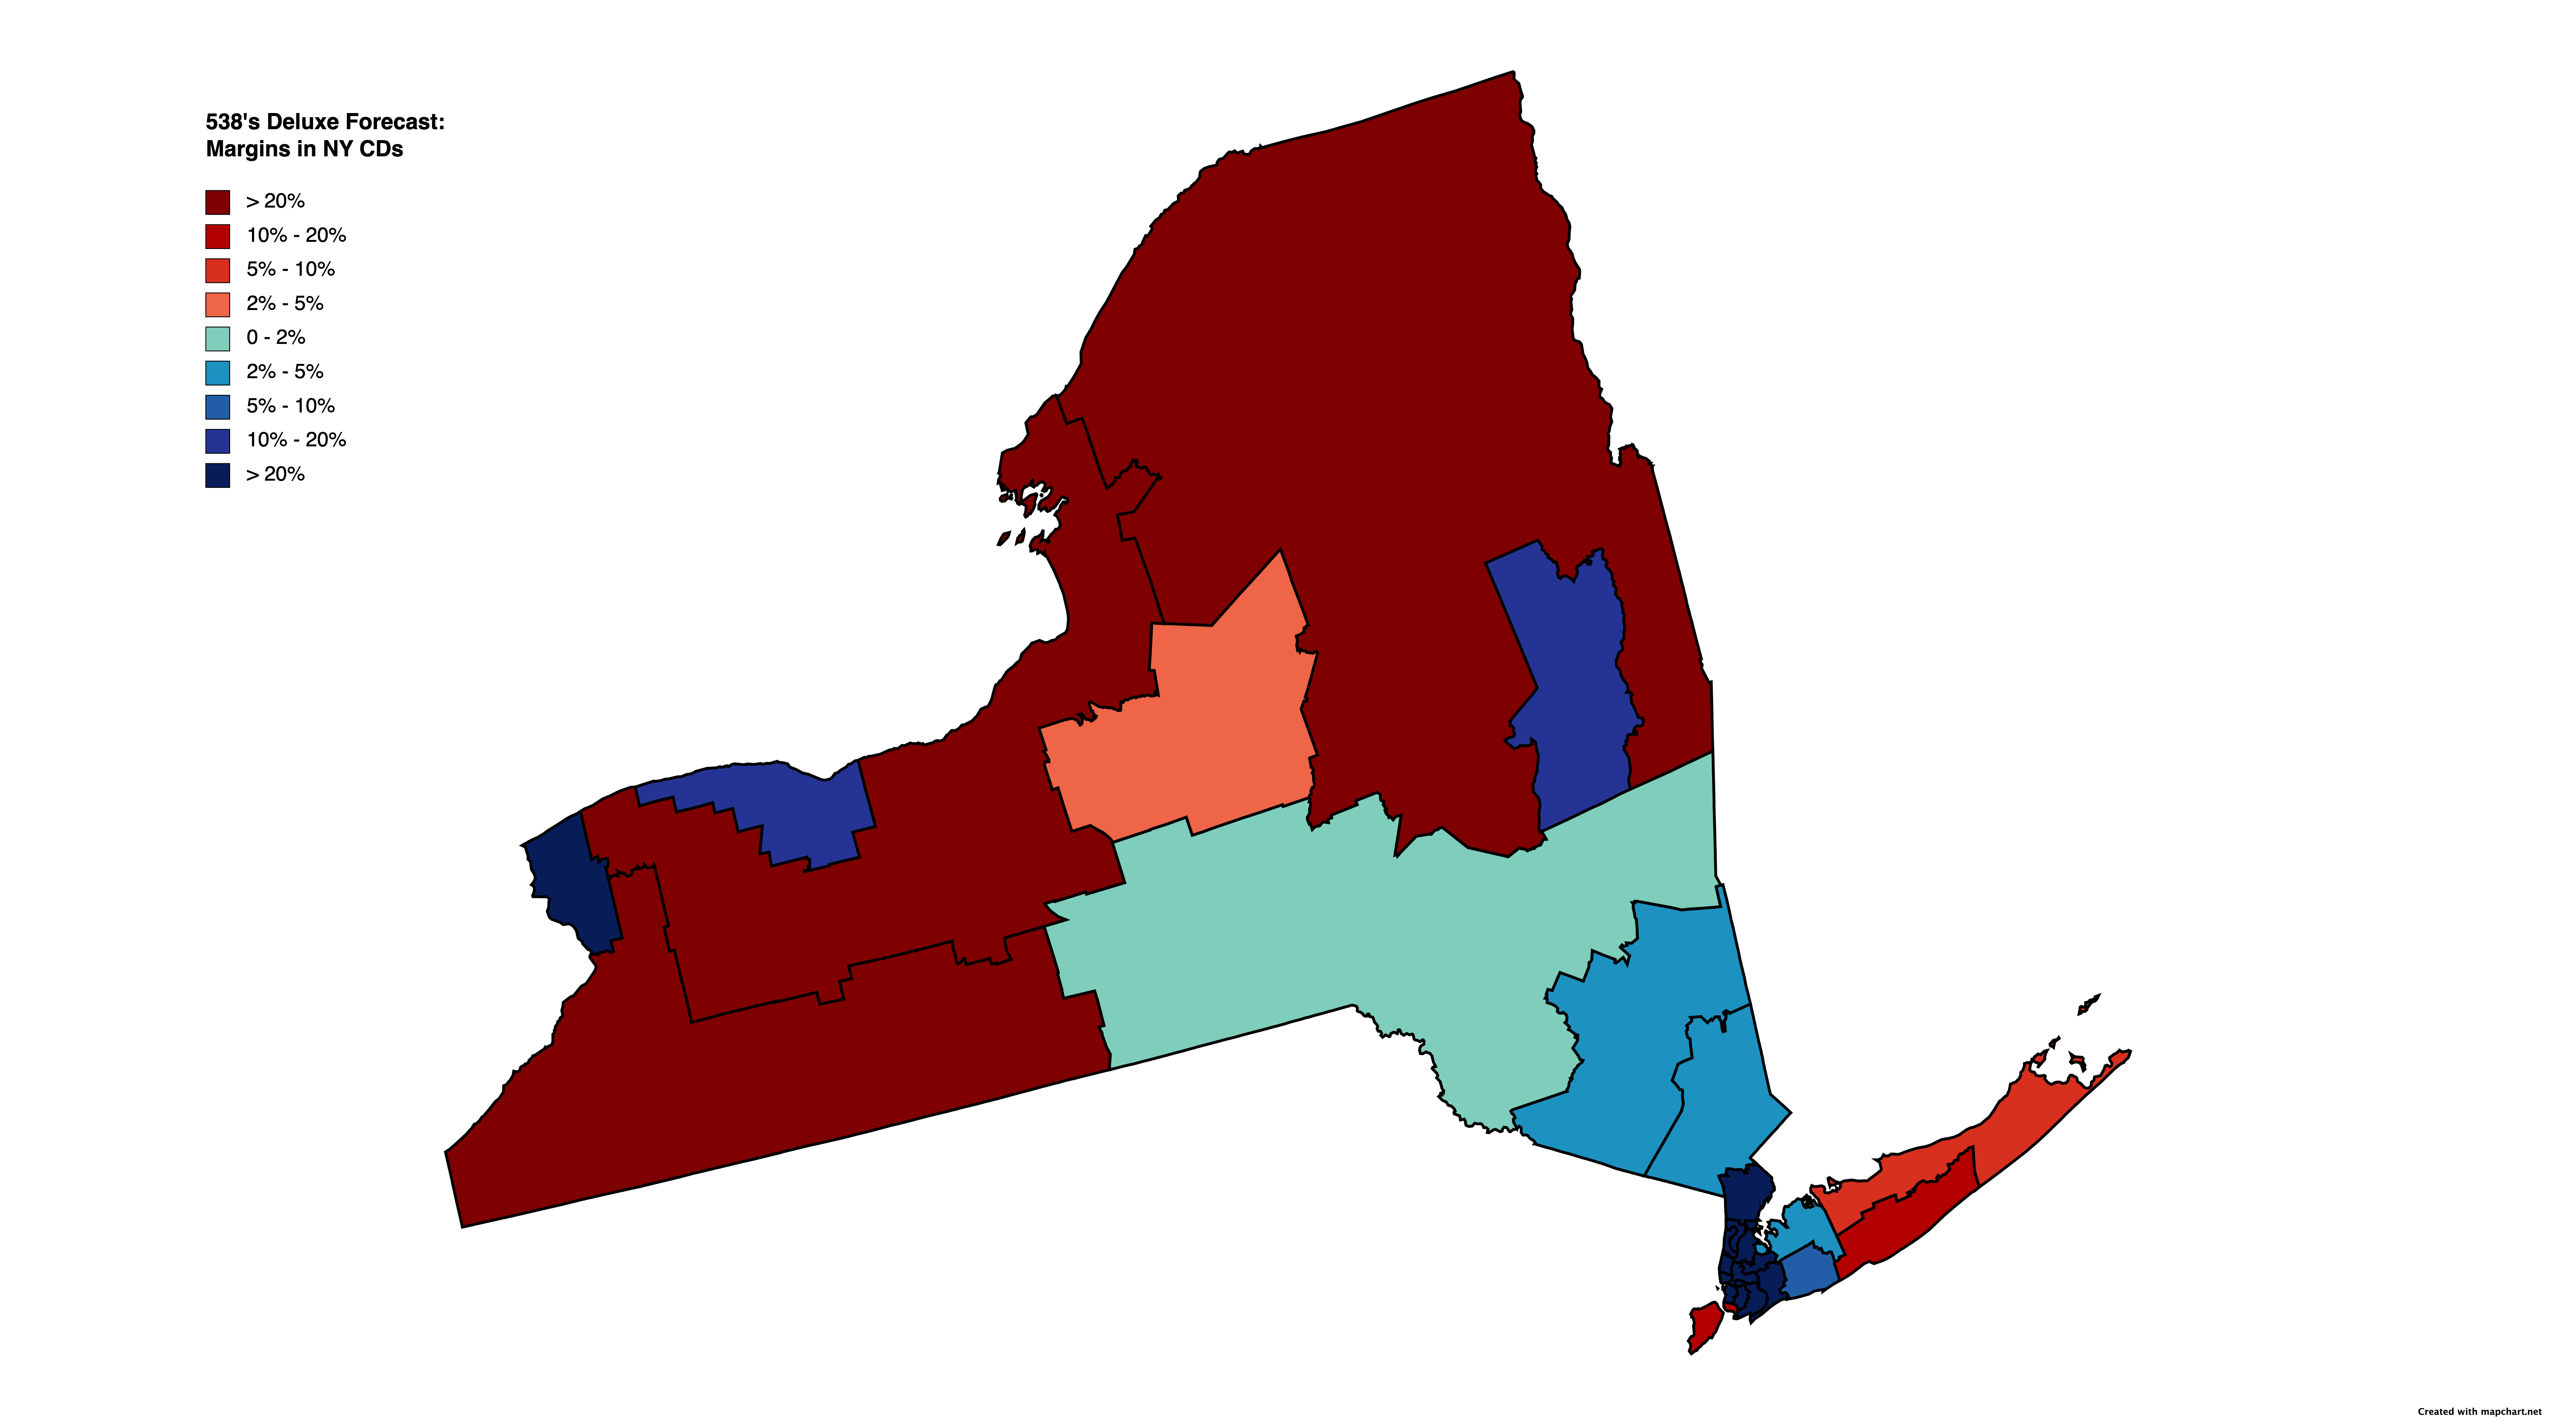
Source 538.com’s model page – not sure you can see the data, but you can try
Democrats had 15 pretty certain and 4 leans, Republicans had 6 pretty certain and 1 lean.
But you know what happened – Democratic turnout, especially in NYC and suburbs, including Rockland and Long Island, was not there. And this is what the map looks like (I am not certain why no one has called 22, that small one that looks like a dog barking right in the center, with Syracuse if you know where that is. But it looks like a GOP hold.)
Unofficial Results: Margins in NY Congressional Districts
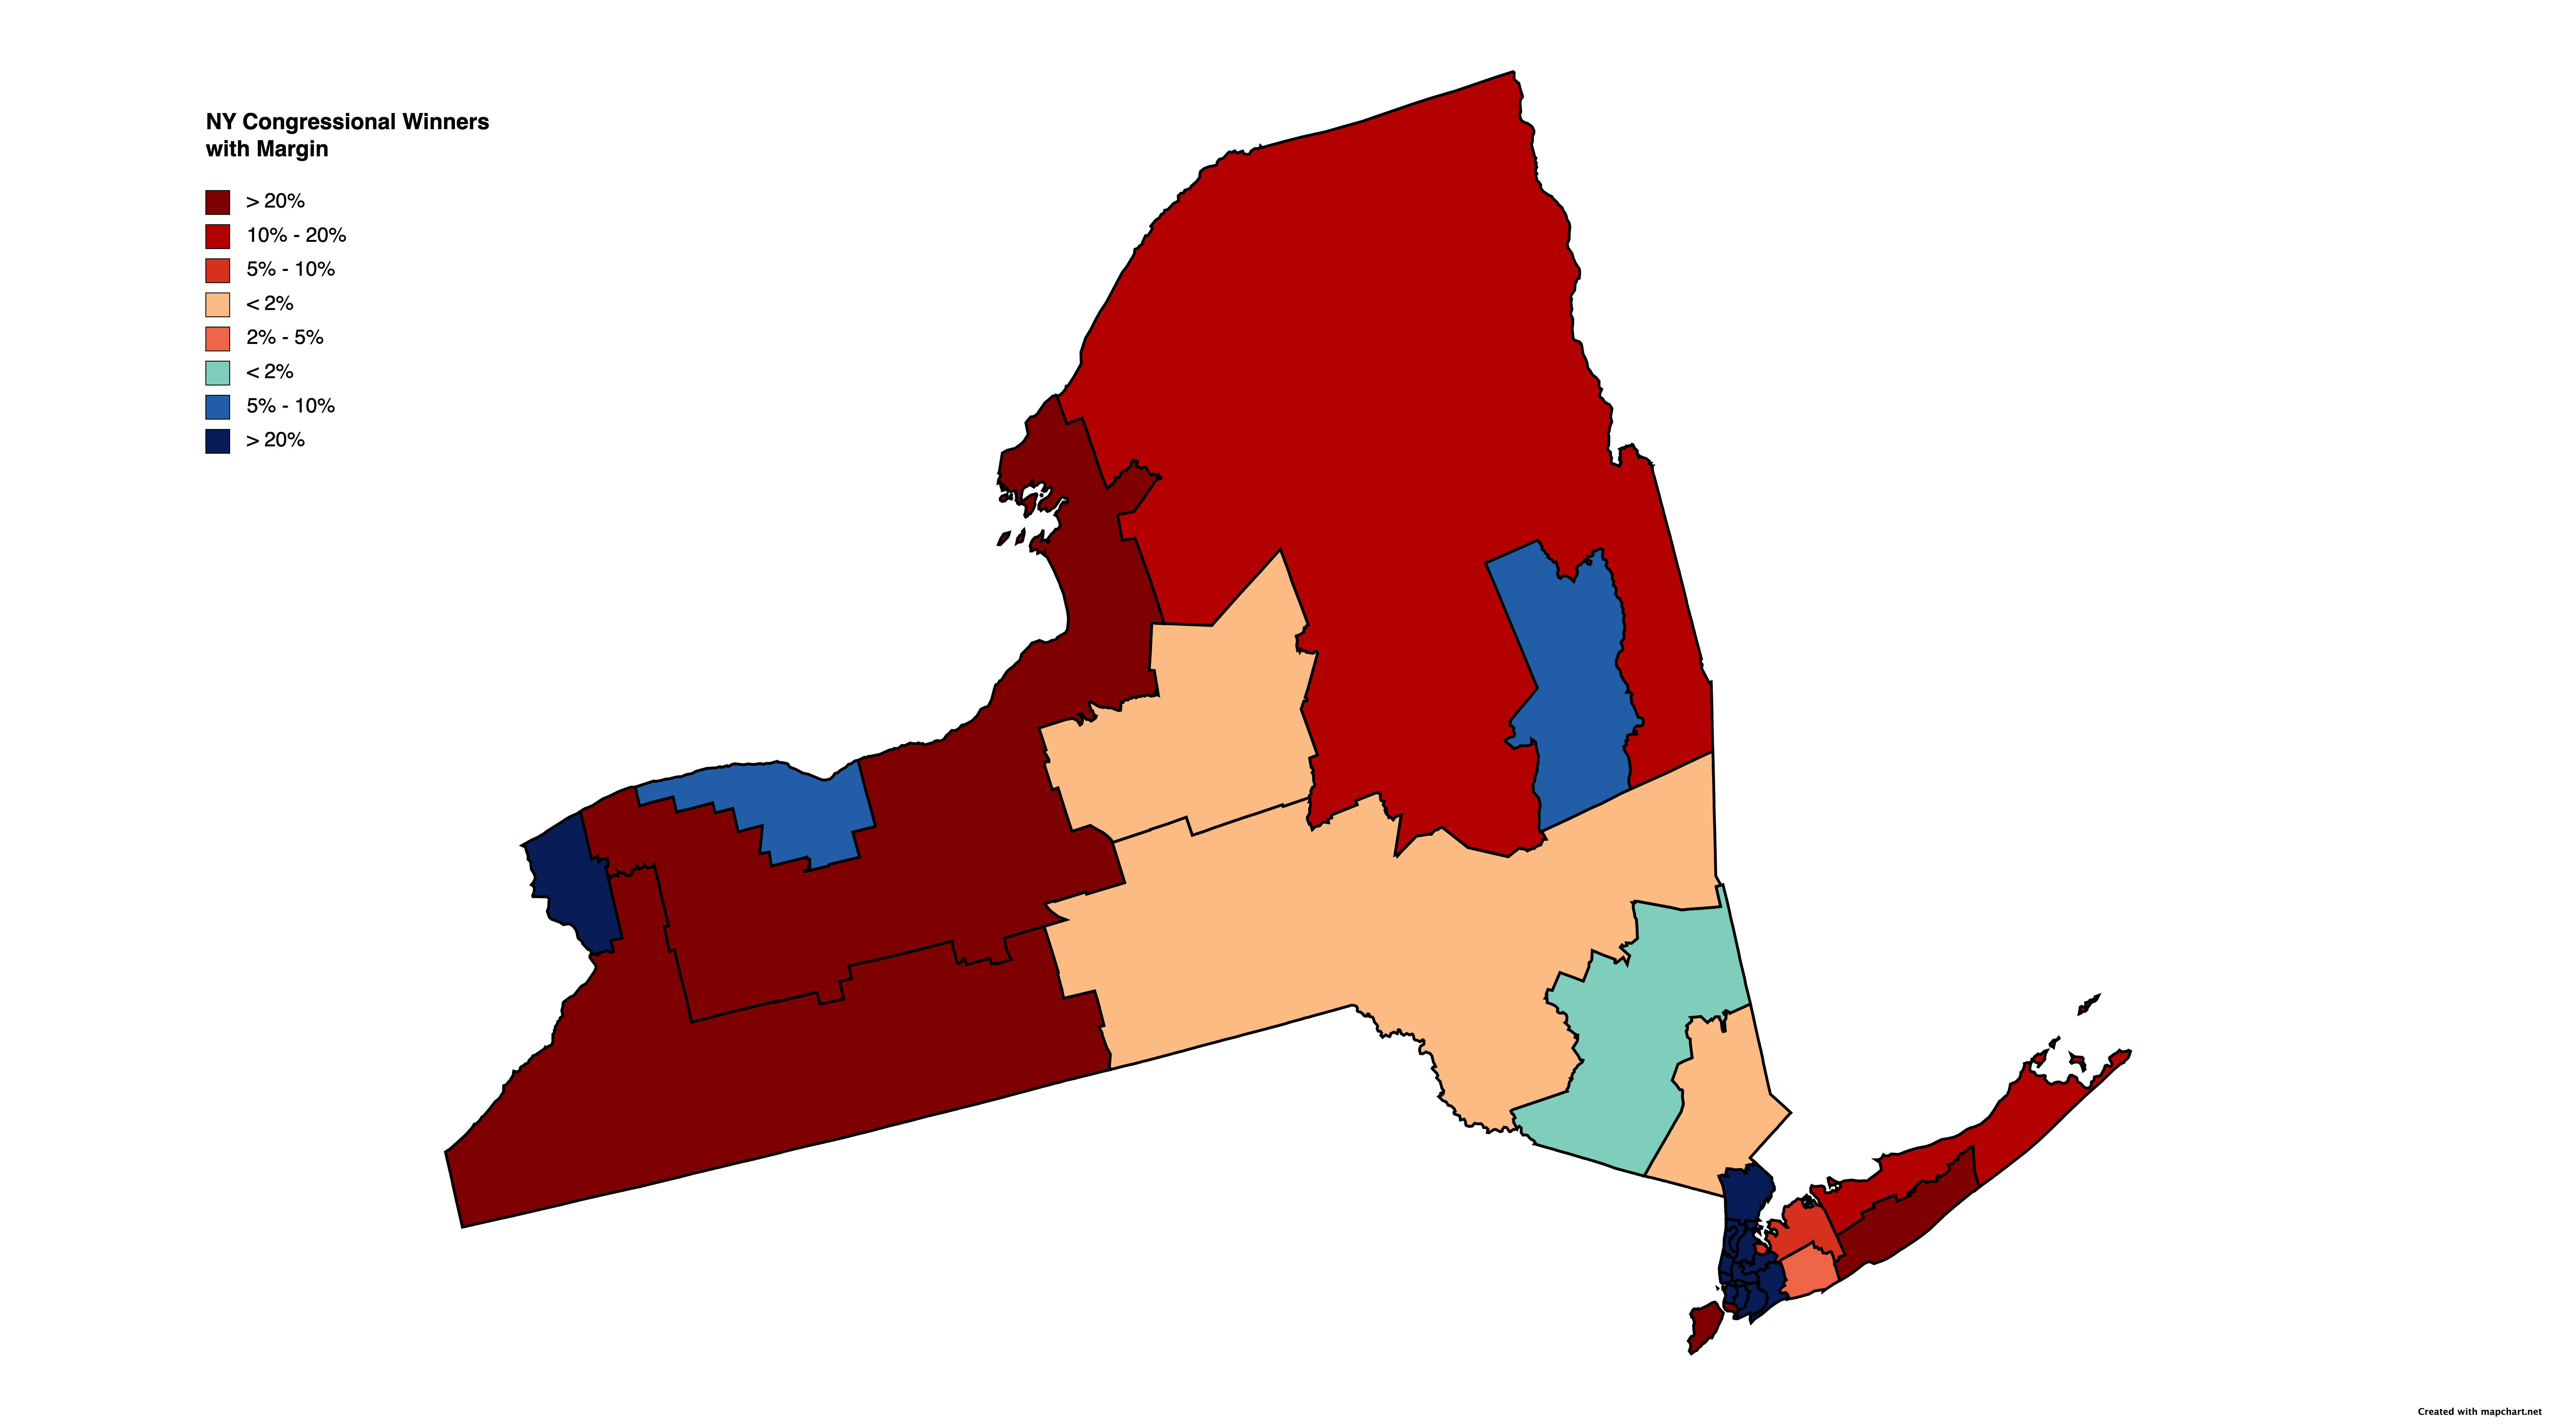
Source: NY State Board of Elections Election Nights Results Page
Immediately I notice that blue belt (20-19-18-17-16-NYC-3-4, above) breaking up. And it is true, those four districts that are not blue, 19, 17, 3, and 4, they are the big New York congressional races news. But I am interested in what’s going on with the votes in New York State.
Let’s look at how much higher or lower margins were than expected. That means not only looking at the flips – but where did each party actually meet expectations. And, I have a feeling you already know what’s going to jump out:
Actual Margin vs Forecast (538 Deluxe) Margin

Where is most of Hochul’s underperformance? NYC. Where is most of Zeldin’s overperformance? Long Island and Staten Island. Look at the rest of the state. Two very close districts flipped, but aside from that, it’s an ordinary map, mostly each party held its own districts by roughly the expected margin.
Specific districts
CD-22, the medium red district in the center that looks like a dog howling – see the snout pointed towards Lake Champlain? And the lower jaw pointing to Lake George? And the stubby tail south of Oswego? It would be clearer if they drew Oneida Lake out, so you could see his left ear. Anyhow, someone needs to draw that dog and make it look beautiful, and someone with more data and skill than I do should look at the demographics and voting patterns of this Erie Canal/New York Central/Central New York district. It is complicated. Rome, Utica, and Syracuse are not like the rest of New York State. I think as the rest of the state swings to and fro, this district may be moving in its own direction.
CD-19, the furthest north of the flipped districts. This is a complicated amalgam of a university town – Ithaca – a fairly Trumpy region, some conservative suburbs, and part of the increasingly hard Democratic leaning Upper Hudson Valley. It too should stay a competitive – perhaps longer than 22, since it’s different parts may tend to drift in different political directions.
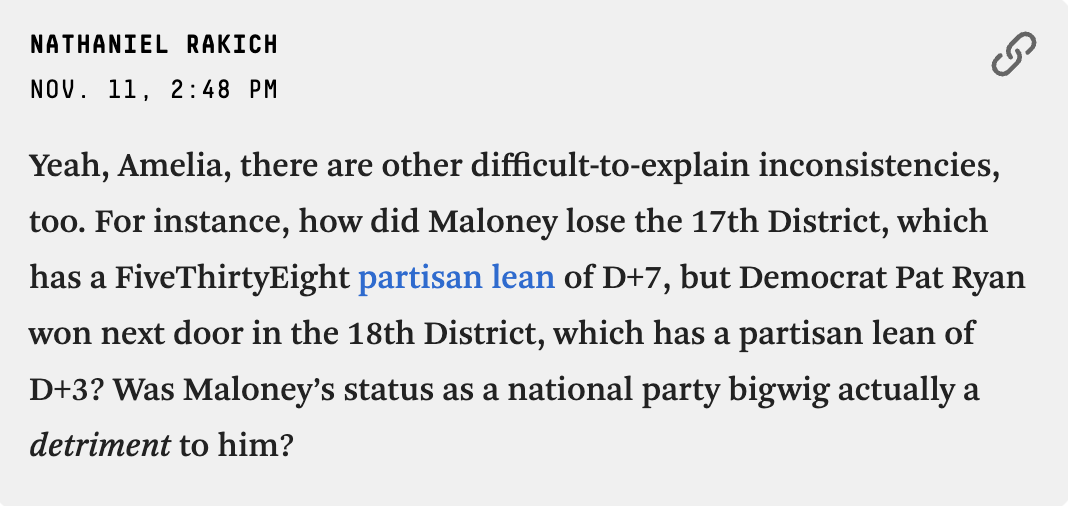
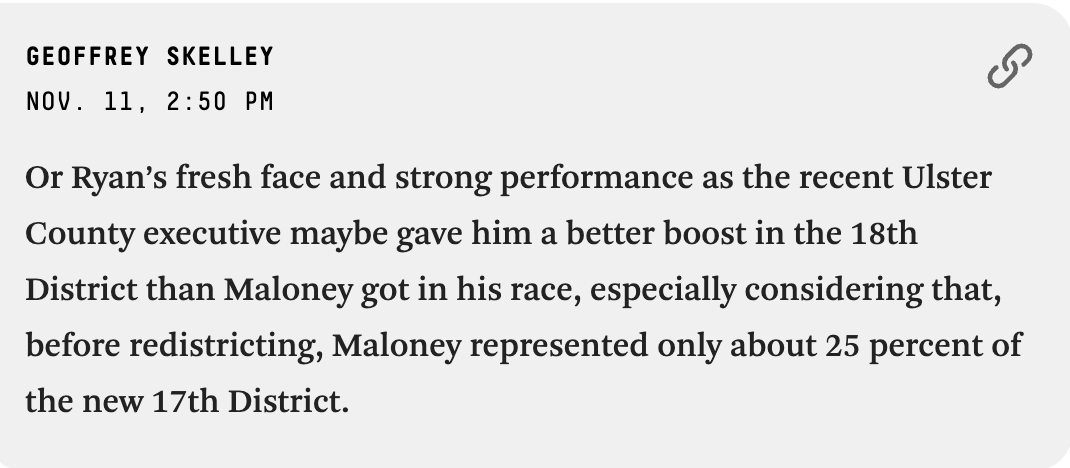
CD-17. There is a story. Sean Patrick Maloney losing is a big deal. He was a non-progressive big shot in the Democratic Party. He bullied his way into the seat, running where Mondaire Jones was serving (Jones ran in the primary in CD10 in Manhattan, screwing up that race and handing it to a friend of the family that runs the New York Times). Alessandra Biaggi primaried Maloney (good for her!), but he won, he got what he wanted, and he lost.
It would be easy for outside observers to take some interesting stabs at what happened, without having any specific information. In fact, I see at 538 (remember, data good, analysis? Meh) they are doing just that:

If you are going to discuss a specific district, it might be helpful to know something about that district.
17 was drawn as a balanced, Democratic-leaning district, drawn from part of Westchester, all of Putnam, all of Rockland, and part of Dutchess. By votes: 42% Westchester, 38% Rockland, 14% Putnam, 6% Dutchess. Now, there’s been redistricting, so no direct comparisons are possible district to district. But not every county line was cut. And we have Rockland returns from the last 2 elections.
Rockland County 2020 vs 2022
| Dem | GOP | |
| 2020 | 68,697 | 54,791 |
| 2022 | 47,591 | 58,288 |
How is this different from Zeldin up some, Dem down a bunch anywhere else downstate? First let me note that there were about 1,200 Zeldin (R) / Maloney (D) voters in Rockland. That’s interesting.
But then, let’s just look at this endorsement: https://www.jpost.com/diaspora/article-721699. This week. Hasids. Zeldin. Strong endorsement. Groups vote en bloc. And there are now 50,000 Hasidim in Rockland County. Yes, Zeldin outran Molinaro. Yes Democratic turnout fell in NYC and the near suburbs. But that endorsement hit Sean Patrick Maloney in CD-17, and did not matter one bit in CD-18.
And then the reason is two-fold. One, they like Republicans, but vote for Democrats if they think Democrats are sure winners. Maybe this is a successful version of “seat at the table” politics. We could send in Unity leaders to learn how it is actually done. But maybe not. The second reason might get in the way.
Under Cuomo, the Hasidic groups used that “seat at the table” to secure unwritten agreements that they could get public funding for their schools, with no oversight. In a famous case, a group sued FOR state intervention, because their kids were learning torah, but not math, not to read and write English, not the things that we really expect schools to do. But I don’t think Hochul made the same dirty deal.
And thus Sean Patrick Maloney may have been defeated by people seeking to keep their children from learning to read.
Long Island
I’m not talking about Long Island. I don’t want to get into any more trouble.

