TDA Unit Values
And now for something quite different.
Corona pounded the stock market, and naturally those who have Tax Deferred Annuities in the market also felt it (or more likely, saw it. This is future money for in-service members)
The fund that I usually hear about, I’m guessing the most popular, is Diversified Equity. In January it was over $105, and in April just over $81 – about a 23% drop. But let’s add some historical context. To start with, one year ago it was at $95. (I’ve left off the pennies). But let’s chart it out for a few years.
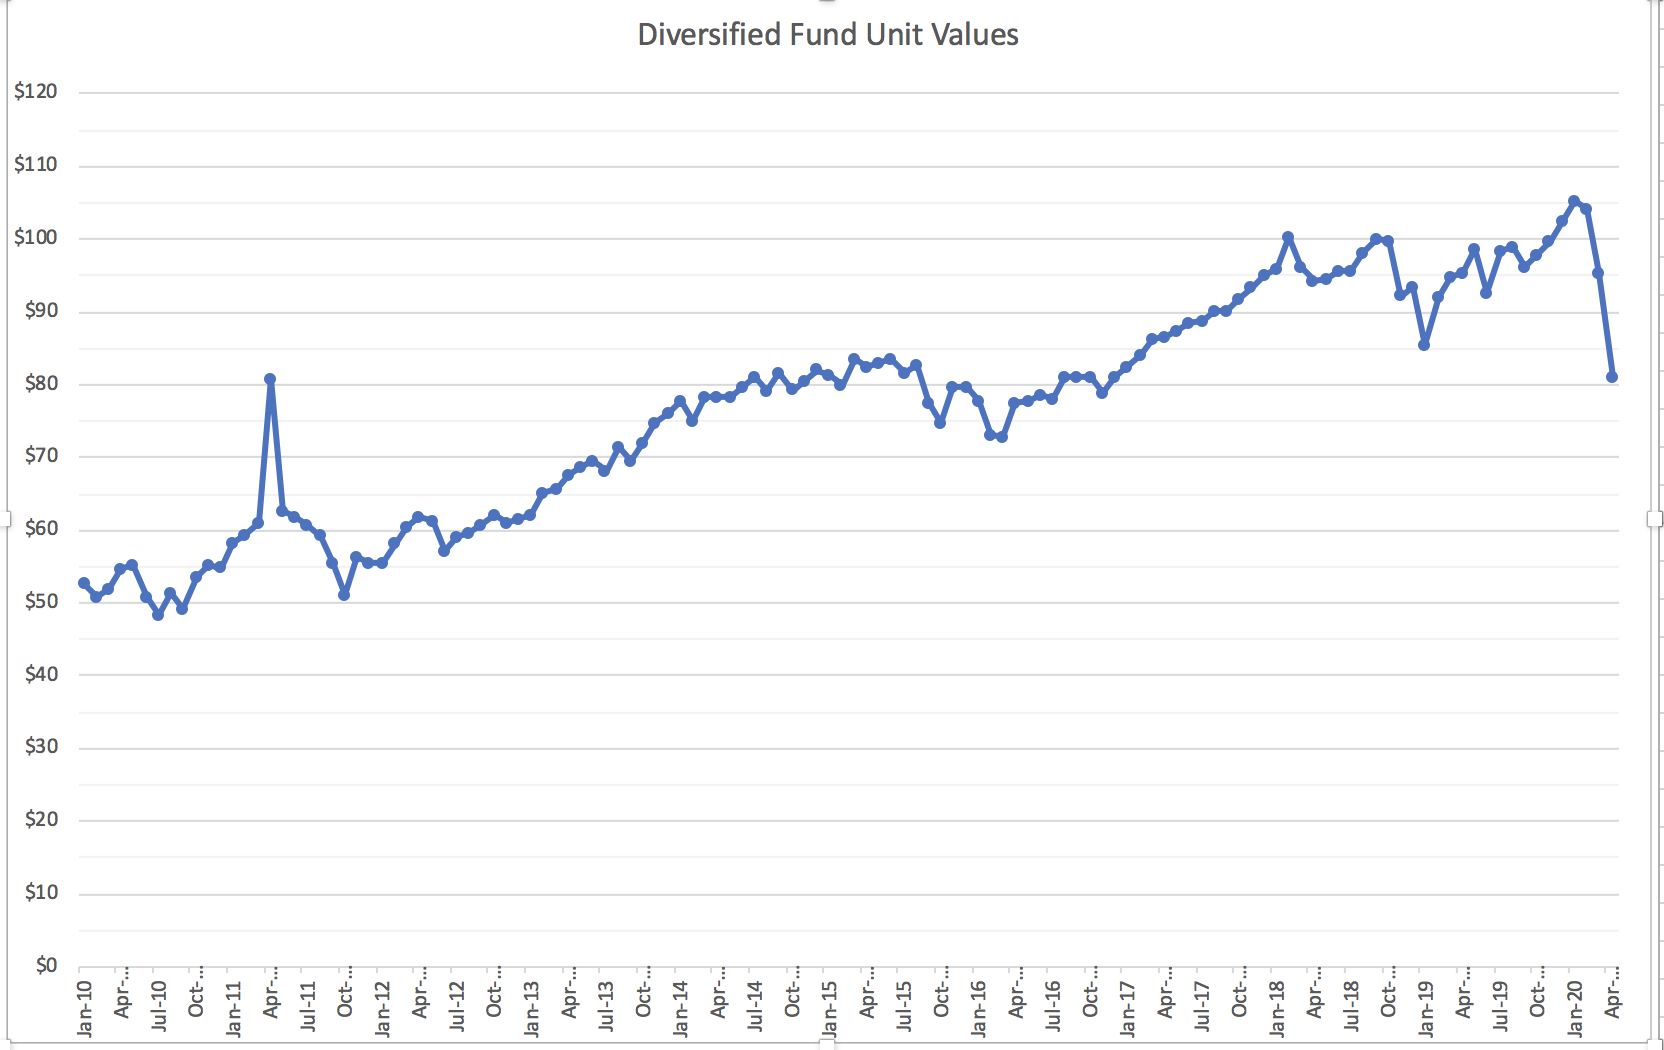
The comparison with inflation may not be useful, but $52.69 in 2010 money would be about $62.17 today.
Look, I wanted to make a chart. I’m not sure how to interpret it. That’s a lot of gain wiped out in a short time, but in the long term?
The raw data:
| Unit Value | |
| Date | Diversified Fund Unit Values |
| Jan-10 | $52.629 |
| Feb-10 | $50.713 |
| Mar-10 | $51.840 |
| Apr-10 | $54.716 |
| May-10 | $55.347 |
| Jun-10 | $50.806 |
| Jul-10 | $48.310 |
| Aug-10 | $51.433 |
| Sep-10 | $49.212 |
| Oct-10 | $53.481 |
| Nov-10 | $55.253 |
| Dec-10 | $54.825 |
| Jan-11 | $58.207 |
| Feb-11 | $59.246 |
| Mar-11 | $61.050 |
| Apr-11 | $80.881 |
| May-11 | $62.750 |
| Jun-11 | $61.897 |
| Jul-11 | $60.624 |
| Aug-11 | $59.225 |
| Sep-11 | $55.426 |
| Oct-11 | $51.100 |
| Nov-11 | $56.249 |
| Dec-11 | $55.541 |
| Jan-12 | $55.630 |
| Feb-12 | $58.119 |
| Mar-12 | $60.467 |
| Apr-12 | $61.719 |
| May-12 | $61.156 |
| Jun-12 | $57.035 |
| Jul-12 | $59.120 |
| Aug-12 | $59.543 |
| Sep-12 | $60.744 |
| Oct-12 | $62.048 |
| Nov-12 | $61.110 |
| Dec-12 | $61.532 |
| Jan-13 | $62.174 |
| Feb-13 | $65.154 |
| Mar-13 | $65.582 |
| Apr-13 | $67.617 |
| May-13 | $68.781 |
| Jun-13 | $69.567 |
| Jul-13 | $68.243 |
| Aug-13 | $71.550 |
| Sep-13 | $69.543 |
| Oct-13 | $72.107 |
| Nov-13 | $74.633 |
| Dec-13 | $76.199 |
| Jan-14 | $77.656 |
| Feb-14 | $75.061 |
| Mar-14 | $78.365 |
| Apr-14 | $78.382 |
| May-14 | $78.290 |
| Jun-14 | $79.626 |
| Jul-14 | $81.078 |
| Aug-14 | $79.251 |
| Sep-14 | $81.499 |
| Oct-14 | $79.271 |
| Nov-14 | $80.542 |
| Dec-14 | $82.029 |
| Jan-15 | $81.363 |
| Feb-15 | $79.846 |
| Mar-15 | $83.661 |
| Apr-15 | $82.492 |
| May-15 | $82.918 |
| Jun-15 | $83.538 |
| Jul-15 | $81.738 |
| Aug-15 | $82.668 |
| Sep-15 | $77.419 |
| Oct-15 | $74.680 |
| Nov-15 | $79.632 |
| Dec-15 | $79.588 |
| Jan-16 | $77.773 |
| Feb-16 | $73.218 |
| Mar-16 | $72.947 |
| Apr-16 | $77.546 |
| May-16 | $77.866 |
| Jun-16 | $78.512 |
| Jul-16 | $78.102 |
| Aug-16 | $81.078 |
| Sep-16 | $80.958 |
| Oct-16 | $81.042 |
| Nov-16 | $78.955 |
| Dec-16 | $81.062 |
| Jan-17 | $82.351 |
| Feb-17 | $83.973 |
| Mar-17 | $86.227 |
| Apr-17 | $86.533 |
| May-17 | $87.440 |
| Jun-17 | $88.399 |
| Jul-17 | $88.681 |
| Aug-17 | $90.261 |
| Sep-17 | $90.080 |
| Oct-17 | $91.800 |
| Nov-17 | $93.288 |
| Dec-17 | $95.100 |
| Jan-18 | $95.898 |
| Feb-18 | $100.326 |
| Mar-18 | $96.212 |
| Apr-18 | $94.245 |
| May-18 | $94.459 |
| Jun-18 | $95.640 |
| Jul-18 | $95.605 |
| Aug-18 | $98.198 |
| Sep-18 | $100.006 |
| Oct-18 | $99.877 |
| Nov-18 | $92.192 |
| Dec-18 | $93.484 |
| Jan-19 | $85.504 |
| Feb-19 | $92.173 |
| Mar-19 | $94.744 |
| Apr-19 | $95.432 |
| May-19 | $98.700 |
| Jun-19 | $92.578 |
| Jul-19 | $98.450 |
| Aug-19 | $98.938 |
| Sep-19 | $96.264 |
| Oct-19 | $97.765 |
| Nov-19 | $99.678 |
| Dec-19 | $102.435 |
| Jan-20 | $105.276 |
| Feb-20 | $104.047 |
| Mar-20 | $95.393 |
| Apr-20 | $81.142 |


How does this compare to fixed? After the 2000 tech crash over the next year I converted the entire TDA which I had 70% in the market to fixed – and certainly took about a 25% hit. But I have no complaints. I read recently that since 2000 the market has trailed other financials like bonds – I think it said the market averaged about 5.5% since then. If there is a depression and consumer spending crashes the market cannot sustain itself. Right now it seems artificially inflated and I used the opportunity to get out on an IRA – this may be the moment to go fixed – and fast. Another issue is will our 7% fixed come under attack and can they do anything about it?
I may extend this, bring it back to 2000? look at other funds? fixed?
I want to be careful to present the numbers (the graph is a neat presentation) but not to analyze, because that is out of my area of expertise.
But since someone else just asked, from January 2010 – January 2020 this fun outperformed fixed. By March 2020 they were about the same (start 1/10) and today the fund is behind – it’s only ballpark, but with paper and pencil I see an effective 4.9% yield. These things bump around, so you are right to ask for the long view.
Big question – the market has somewhat restabilized. Is that real?