Finding School Survey Results (NYC)
Want to know what teachers think about a school? Best way to find out is to talk to those teachers… but that’s often not an option. And especially for teachers considering transferring, it’s important to get some idea of the mood and relationships – stuff that never appears on the school’s website.
One option is to check what teachers wrote on the school surveys. Now, this is not a perfect option. Many teachers do not fill out the surveys. Many do not trust that they are anonymous, and fill them out to please their administrators (I DO think they are anonymous. I encourage people to fill them out honestly). But this means that the surveys MIGHT reflect more positively than they should. The surveys can give a falsely upbeat view of a school. But a negative result on a survey – that’s a pretty good indication that there may be a problem – certainly I would recommend doing further research before accepting a position at such a school.
A positive result on the surveys might be meaningful, might not. I don’t put much stock in them.
A negative result on the survey is usually a clear warning that there is, or was, a problem. That’s a warning alarm. Do check to see if administration just changed – but otherwise – uhuh. Probably that’s a no.
In the past I published some results from these surveys. That’s years ago. I have time; I should get back to that. Gene Mann publishes abbreviated results for Queens (I think), which is a service.
But let’s say you want to find the results on your own. I am going to look at two neighboring middle schools in District 11 in the Bronx, 180 and 181. How do you we find them?
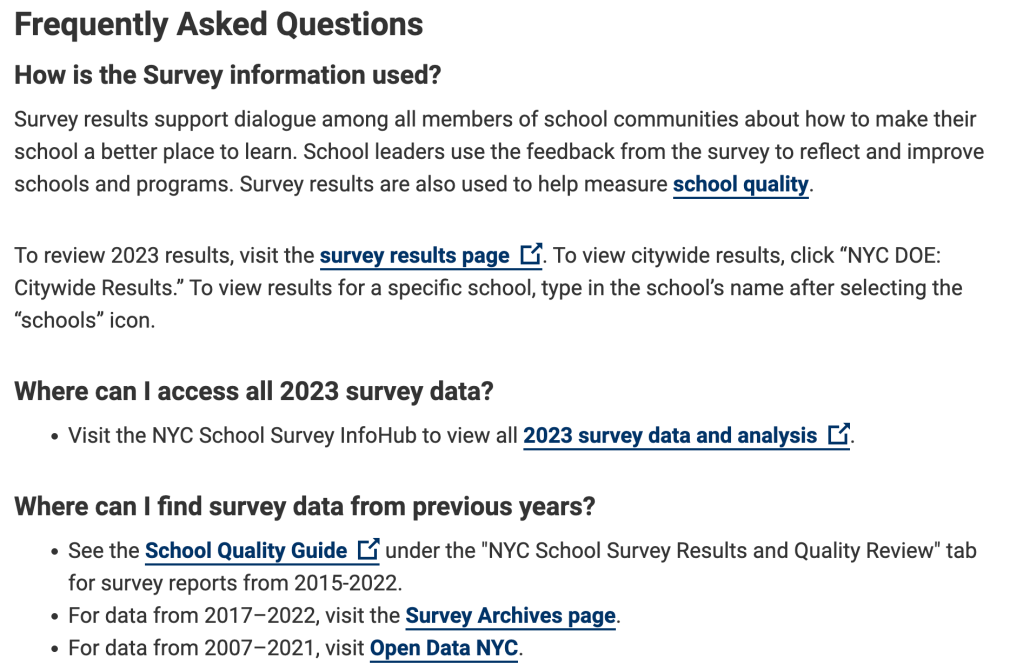
I generally do not navigate directly to the page, since I do not trust Panorama links to stay stable. I start at: https://www.schools.nyc.gov/about-us/reports/school-quality/nyc-school-survey and click the 2023 Survey Data and Analysis link.
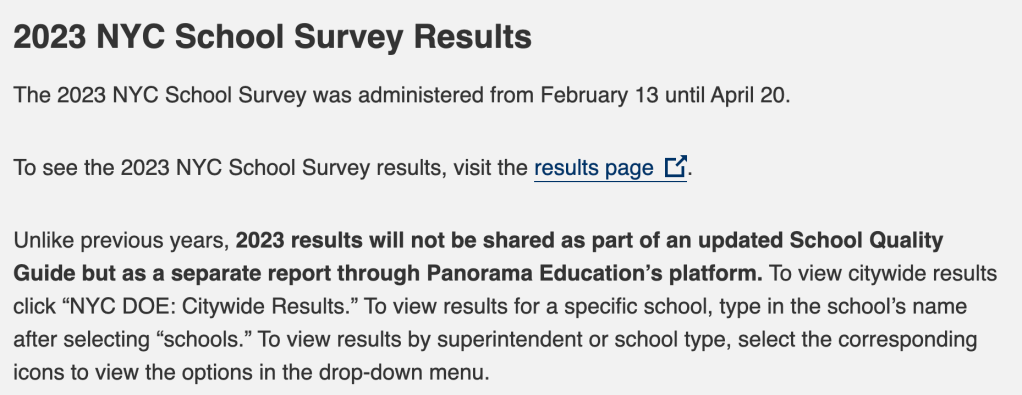
That link brings me to this page: https://infohub.nyced.org/reports/students-and-schools/school-quality/nyc-school-survey and then I click on 2023 results:
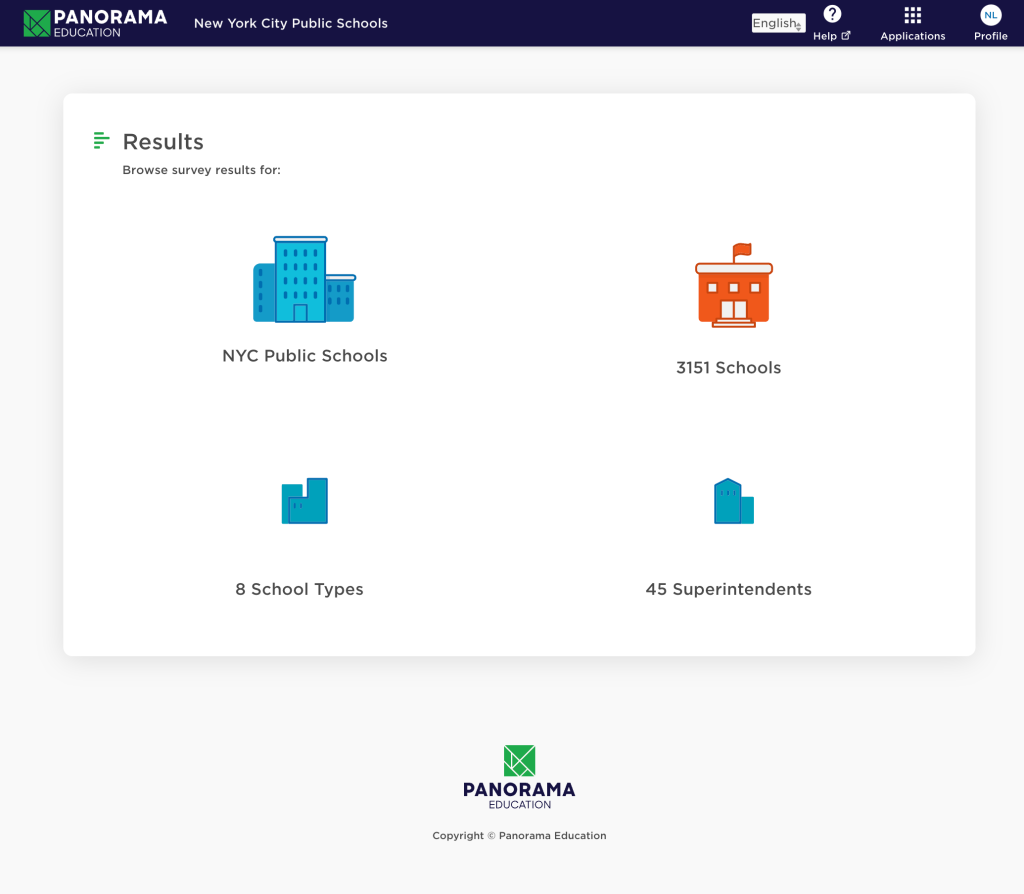
Which brings me to the first Panorama page https://secure.panoramaed.com/nycdoe/understand:
Everyone wants to click on the red/orange “3151 Schools” first. I don’t. I start by clicking the blue buildings on the upper left “NYC Public Schools” – and I see a weird table (which I don’t care about):
In the upper left there are some options. “City” is highlighted. Change that. Click “School”
and we move to a massive table, with lots of colors. Adjust your window to fit as much as you can:
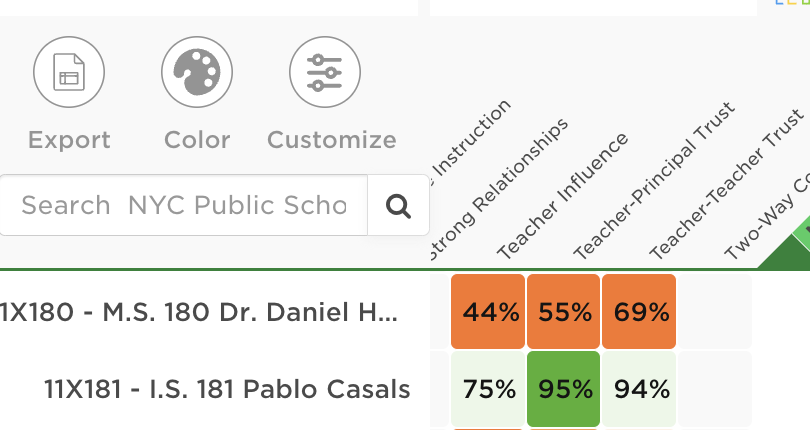
Those colors – the deeper greens are for good results, the rustiest red/oranges are the worst. The schools are listed by district, so I’m going to scroll down a bunch to reach District 11, where 180 and 181 are. I put the two schools on one screen:
Wow, that’s a lot of data. What to look at first? I suggest the three columns in the next to last group on the right: Teacher Influence, Teacher-Principal Trust, Teacher-Teacher Trust.
At this point we have our first order answer – teachers at one of the schools trust their principal. At the other, nope.
There’s more we might notice. At the second school, the principal trust box is one of the greenest – in other words – place may not be perfect, but teachers like the administration. At the first school, with lots of poor and mediocre ratings (from kids and parents too) I notice that safety is better than the other ratings (both teachers and kids say so). Probably doesn’t make up for the overall ratings, but something to think about.
Sometimes looking at which numbers do not fit the picture raises interesting questions. Kids love the school, adults don’t? What’s going on there. “Instructional Leadership” is much lower than “Teacher-Principal Trust”? Might be a “nice guy, can’t run a school” situation. And the reverse, instructional leadership is well-rate, but teachers don’t trust the principal? Things to think about.
Let’s go back and take a look at the individual schools. Find your way back to the first Panorama screen, but this time pick the red/orange building that says 3151 schools:
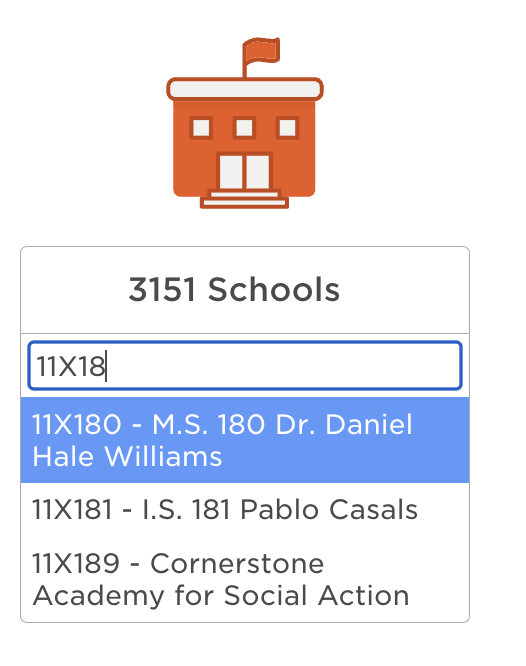
When you click on the building, you get a search list. Scroll down to your school, or type in the name:
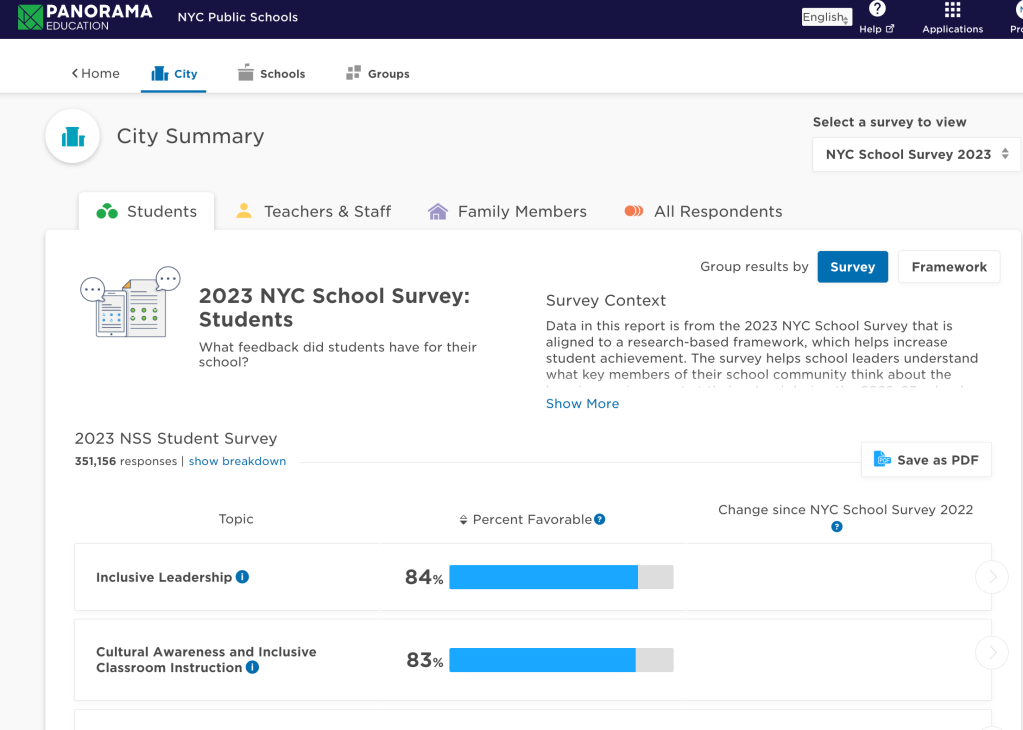
And then click it. You will see a big set of blue bars.
That is the student results. Look at the top of the screen, and flip to teacher results:
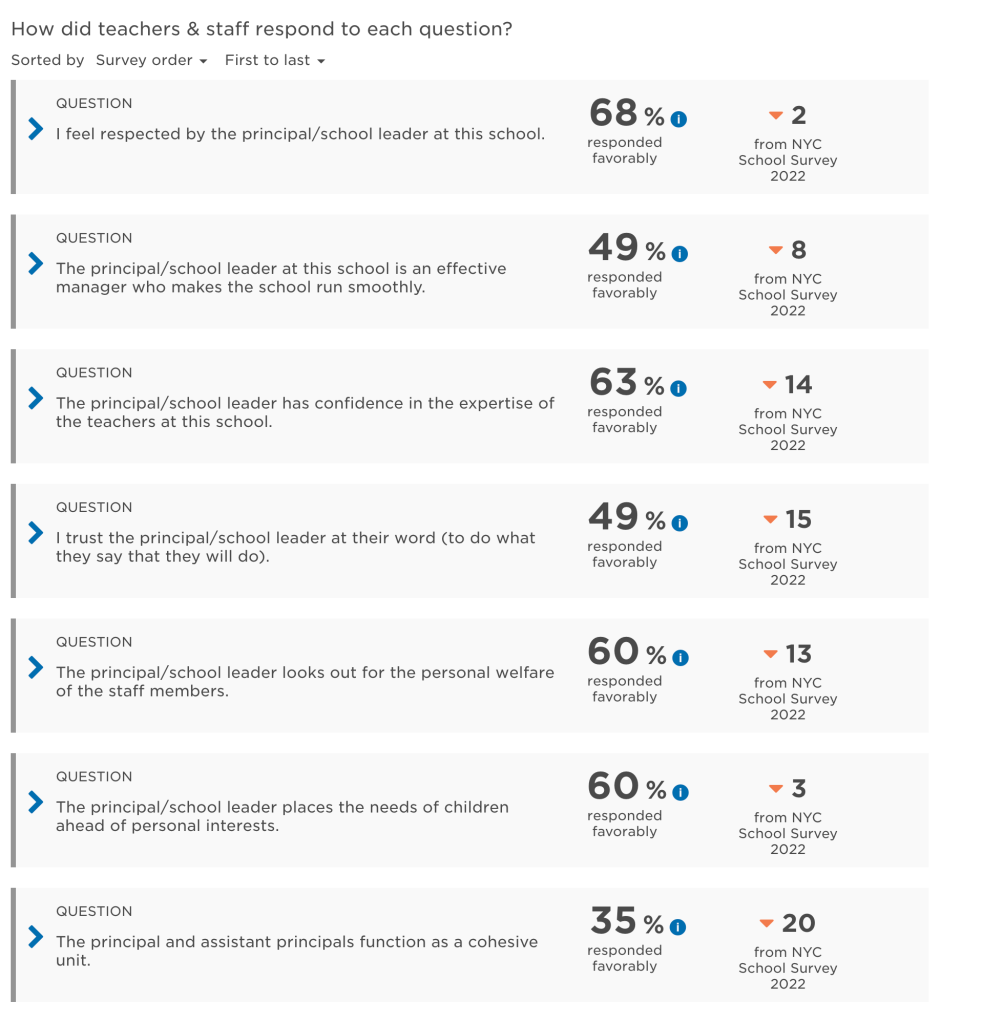
Now, we have lots of options to choose from. This is 180, I’m going straight to Teacher-Principal trust, because that was what concerned me most. (Don’t worry about the blue bars, just find your question)
Turns out, there are a bunch of questions that go into Teacher-Principal trust (near the bottom of the list). Unfortunately, they don’t point to an alternative narrative.
I do notice that the numbers have all fallen a bit from what were already sub-mediocre scores the year before… but I don’t see anything that makes me curious to dig further.
Limitations
I want to be clear – the surveys don’t get everything “right” – they are what staff filled in. Maybe the staff was angry that day. Or maybe they filled in the survey with the principal standing over them. Lots of things could mess up the data.
But when a staff fills in negative information, I think that is at least a signal that you should look more closely.
And when the ratings for a school are consistent (high, medium, mediocre, low) but one or two scores buck those trends, I pay A LOT of attention to those exceptions, and you should too.
