Why is NY’s Covid Decline Less than Everywhere Else?
The United States is on the declining side of a third major COVID wave. The first, March – April 2020, largely hit the west coast and the Northeast. The second, summer 2020, was felt in those places that had not been as severely effected in the spring. And the third, present everywhere except Hawaii, began in the fall and had two peaks associated with Thanksgiving and New Years.
That third wave, this current wave, is subsiding everywhere. But less in New York than in any other state. How do we know this? And what is going on?
Comparing Waves – Not So Easy
During the first wave, testing and reporting was all over the place. Each state had its own methodology (and to some extent still do, but there’s been convergence). COVID was not as quickly or readily identified. If we look at a graph of new cases for a state that was in the first and third waves, we will see two humps – but we won’t be able to compare the sizes of those humps, because testing and reporting are much more consistent today than they were 11 months ago. For the US as a whole, the 3rd wave hump appears 8 times higher than the first wave hump – but it is likely that the two waves actually have peaks that are not so different from each other.
Treatment now is better. The proportion of cases that lead to hospitalization is down. The use of drugs, the use of ventilators – changed. Better drugs are being used. And proportionately more people who get sick are recovering.
What we can tell from New Case Graphs
- We can see whether or not a wave affected a state. There’s a visible hump in the new cases graph. Easy.
- We can see when a wave began, when it ended, whether it included peaks and declines.
- We can see how steep an outbreak is, and how sharp or how incomplete the fall-off after.
I will look at New Case Graphs in my next post.
Case Rates
I started collecting maps of case rates in November, and continue updating every few days. Andrew Cuomo got on tv, said New York is doing well, and pitied states in the upper midwest, great plains, and Rocky Mountains that had been hit with an early outbreak in what would become our third wave. He dragged out the name of the state “Wyoming” several times, in some sort of awkward joke about other people’s suffering. I said to myself, “Cuomo’s an asshole. People need to be reminded.” And I like maps, so I started making some.
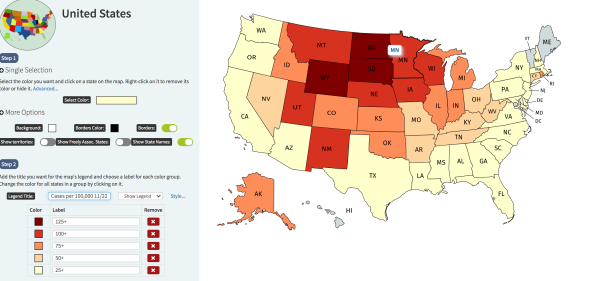
In this series of maps you can see the Wyoming spike, surges in Rhode Island, Delaware, eventually a spread into south… and the retreat, starting in the northern Plains, then the west and the midwest, leaving the southwest, south, and northeast lagging.
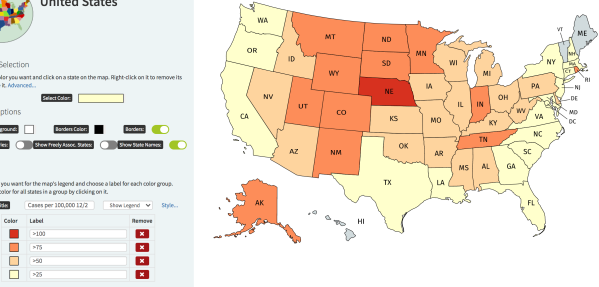
Because of my scale (over 25 cases per 100,000, over 50, over 75, etc) something is missed. Anything at 25 or over indicates community spread. So that pale yellow is not as bad as deep orange, but it is still bad. And now, as we are on the downward slope, I wish I had distinguished between 40 (NY is at 46 cases per 100,000) and 30. The map doesn’t tell you this: New York State has the second highest case rate in the country, and is coming down more slowly than anywhere else.
November 22. Huge spike in the Dakotas. New York’s numbers are lower – barely in the community spread range.
December 2. Spike is falling off. Rising numbers in Midwest and Appalachia.
December 15. Numbers rising in the southwest, lower midwest, southeast, northeast. New York’s numbers are rising, but not like its neighbors.
January 1. Decline in the northern Plains. Near peak in the southwest and south. Northeast is steady.
January 15. High numbers in Arizona. Surges in the southeast, northeast. New York stands out, but is still near the bottom of the range (maybe 10th in the country). But the direction is bad.
February 1. Numbers are declining pretty much everywhere. More than a dozen states are below 25 cases per 100,000 (threshold for community spread). Higher rates in the south and northeast. New York is starting to stand out.
Third wave is ending. Numbers are declining everywhere. NY at 46 cases per 100,000 is second highest in the country, and declining more slowly than all other states. New York and South Carolina are the only states with worse numbers today than they had in mid-November.
Next
I’m taking a look at New Case Graphs – there’s a lot to look at. I’m hoping for later this week.
For now, let me leave you with a few New Case graphs. How does New York’s graph compare to the US as a whole, and to our neighbors Massachusetts and Pennsylvania.
Why does New York show no post-Thanksgiving and post-Christmas dips? Why have we only fallen to our post-Thanksgiving level? – and not the early November level that the rest of the country has returned to? And why are we still at 60% of our third wave peak? – and not at 50% like Penna., 40% like the country as a whole, or 30% like Massachusetts?
Why are our new cases remaining so high, even as the third wave recedes? What’s going wrong in New York? For next time.


Trackbacks