CC Algebra – conclusion – Why fewer strong scores?
I wasn’t teaching last year. Sabbatical. And that was the year that Common Core Algebra arrived. I was spared figuring out the exam from scratch. I consulted with teachers from across the City and New York State, debriefed. I looked at the exam. I looked at the State-supplied modules.
This year I had a number of students sit for Common Core, a number for the old Integrated Algebra regents, and a number for both. But I chose to teach as if they would all sit for Common Core. I made very few adjustments to what I usually do in algebra (mostly 1. changing a couple of “function” lessons into a full, rich, challenging unit – starting the discussions with graphs, then moving to applications, 2. tacking on a new stats unit at the end, and 3. leaving an extra few days for regents review.)
I have been doing this high school math teaching thing for a while. I have a pretty good idea of what my students know, and what they don’t. I can tell the difference between short-term memorization, and understanding. I see how they perform on a written test versus during classwork or question and answer sessions. And I had a fairly good idea of the content they would be looking at. And something weird happened. Two things, actually.
Kids who looked like high 80s kids, they got high 70s on the Common Core. I had heard similar reports from around the State, about high performers.
And kids who sat for both exams got virtually identical raw scores (points), but vastly different reported scores. And I heard anecdotally that something similar happened across all of New York City.
Anti-public education reformers (Cuomo, Gates, TFA, Rhee, Pearson, Coleman) claim that common core standards are higher, or that the content is more rigorous. But they are ignorant, lying, or both. Raw scores stayed the same, but reported scores showed large differences. The problem was in the conversion chart. Take a look.
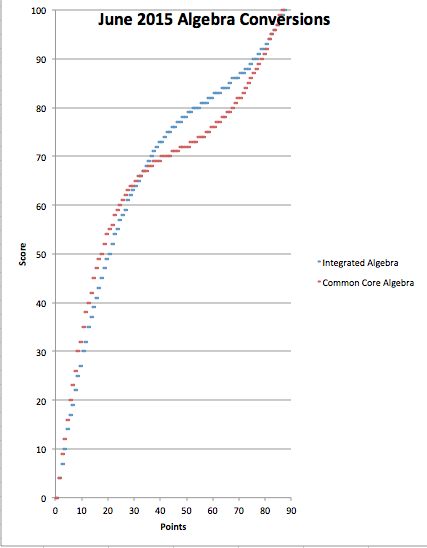
It looks like someone has intentionally depressed scores between 70 and 90, most dramatically between 80 and 85! And it looks that way, because that is exactly what they did. That 5 to 10 point drop? Here it is. Not in the exam. Not in harder content. Not in higher standards. That drop can be found in a new conversion chart.
The exact mechanism is fairly uninteresting, but assuming that you have just read through four pages of this stuff, it would not be right to omit it.
All of New York State uses four performance levels. That’s the way scores on the Elementary School and Middle School tests are reported – 1, 2, 3, or 4. And for high school? We paid no attention to the levels, because we had actual scores, but Level 1 was failing, Level 2 was 55, Level 3 was 65 (passing) and Level 4 was 85 (mastery).
With the Common Core exams, the State amended these levels to cause a drop in scores. They added a Level 5. They set it at 85. And they took the old Level 4, and let the cubic regression set it. It seems to be sitting around a 73. This means a child who was ready to score an 85 on the old test, but who was well-taught for the new test instead, will score a 73. This is not this year’s child knowing less or being able to do less than last year’s child. This is instead New York State directly lowering scores.
Here is how they define the new performance levels:
- NYS Level 5 Students performing at this level exceed Common Core expectations.
- NYS Level 4 Students performing at this level meet Common Core expectations.
- NYS Level 3 Students performing at this level partially meet Common Core expectations (required for current Regents Diploma purposes).
- NYS Level 2 (Safety Net) Students performing at this level partially meet Common Core expectations (required for Local Diploma purposes).
- NYS Level 1 Students performing at this level do not demonstrate the knowledge and skills required for NYS Level 2.
By the way, performance levels are absolutely arbitrary.
I asked about this on the AMTNYS listserve, and received the following response from a professor who was involved in the process:
Jonathan,YES, the state has changed how it sets the scale. I can speak to this as I was a (small) part of the process.Level 4 now means “Proficient in CC”, and this was set by the Commissioner after a recommendation by a group of educators who argued loud and long about what a proficient student should and should not be able to do.Level 5 now means “Exceeding CC expectations”, and this was set in a similar way.The old Level 4 is gone, and it is replaced with these two new levels. The cubic is also gone, and I don’t know everything about the function that fits the rest of the scores. I do know, however, that educators took a hard look at the CC standards and at actual test items to determine which ones should be answered well by proficient students.The new exams are harder and the new standards are higher. We know that the State is closely monitoring the Algebra results because the Class of 2022 is coming soon, and they will need to pass at Level 4.Teachers should be looking at the number of points necessary to hit those cut scores and not at what percent corresponded to what score. The only four scores that really matter are the ones that set Level 2,3,4,5. The fact that a student got an 88 doesn’t mean he knew 88 percent of the material; it means he exceeded CC expectations. The fact that a student got a 62 means nothing except that he is eligible for the safety net.Best wishes to you as the school year winds down.
Looking at performance levels instead of looking at scores is foreign to us. Just telling teachers to do so isn’t fair, not without looking more deeply.We distrust the state. Sounds like I’m being tough on the State, but it was the State, not the teachers, who changed the state exams, and renamed the state exams, and tweeked the state exams, and changed the state standards again and again and again over the last 15 years. It was the State that has produced at least one bad question out of every three exams published for a decade. The State has earned our distrust.Teachers face kids and parents, regular folks, who know 88, but who don’t know that 4 is the highest, (unless 5 is highest).Teachers also face parents and kids in some districts who score highly and want Regents Diplomas with Honors. http://www.p12.nysed.gov/part100/pages/1005.html#diplomaHonorsA district can “award a student a Regents diploma with honors or a Regents diploma with advanced designation with honors to a student who achieves an average of 90 percent in all Regents examinations required for the diploma.”Notice that, it’s not an average performance level of 4.5, it’s an average score of 90. And that just got tougher.
And that, patient readers, is that. The State wanted to make Common Core look tough, so they took the old scores between 85 and 100, and stretched them so they are now between 73 and 100. Top kids have lower scores, by design.
Who’s responsible? Andrew Cuomo? Merryl Tisch? Candace Shyer? Steve Katz? Idk.
– – — — —– ——– ————- ——– —– — — – –
In Part I we saw how, when Common Core Algebra replaced Integrated Algebra, teachers tried to figure out how to adjust to the change. But even with adjustments, scores for top kids fell. I adjusted, as I had for exams in the past, but kids who seemed prepared for scores in the mid-80s saw scores in the mid- to high 70s instead. Similar reports came from across New York State.
In Part II we saw how kids no longer earn their scores directly. In the 1990s and before, score 85 points, and your score is 85. Since 1999 though, points and scores were untethered. The number of points was reduced to a number between 80 and 90. And for each exam administration a new “conversion chart” is created, that seemingly magically translates points into a score. Importantly, the conversion chart changes every time the exam is given. The number of points needed to passvaries each time the exam is given. The number of points needed to get an 85 varies each time the exam is given.
In Part III we looked at how the Conversion Charts are created.


Here’s one comment we wrote on this issue:
http://mathforum.org/kb/thread.jspa?threadID=2716455&messageID=9801197#9801197
Thank you for taking the time to explain the historical context of the grades. People need to be aware that many of these odd grading mechanisms have been in place for years,and now tsunami has hit with everything happening all at once.
I took the algebra common core regents last year and did better than I had hoped for. Granted, it was not mastery, as I had been aiming for, but I was pleasantly surprised at my almost 80 grade. All year my algebra grade was between the high eighties and mid nineties. All throughout middle school my math grades had been descent, but not great, I really hit my stride in algebra. I agree that the grading is ridiculous on this exam. You could easily only get less than half the multiple choice right and pass, while the rest of us who took to time to study barely made the mid seventies. I took the regents again in August, hoping to get and 85, but fell short again. I think that the exam was reasonable both times. Looking back I can see my mistakes, thanks to the internet, and learn from them. The test was difficult, but it can be mastered. I feel as though I would have done better if I had had more time. I distinctly remember the last ten minutes of the June exam where I was scrambling trying to fill in my answer sheet and finish the six point question, which was insanely long, they wanted me to graph a porabla and make a chart that went up to 150! There simply wasn’t enough time left for me.
As my algebra teacher would say the regents is now a reading exam with a little math thrown in it, which is true. I am an avid reader and even I had to read some questions a few times over to get the point of the long, wordy questions.
As the geometry common core regents come up I can only hope that it will be better than my past math regents experiences.